
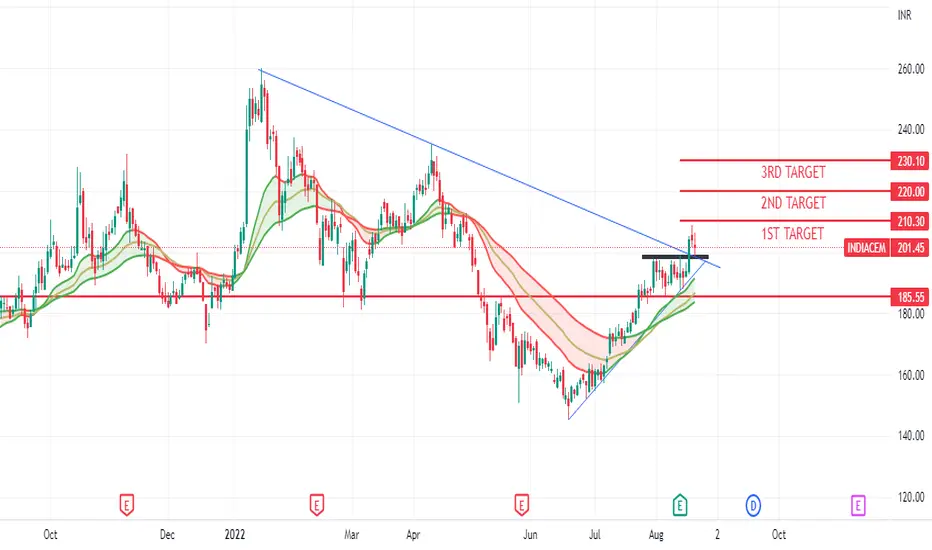
India cement making good price action pattern in daily time frame,
this stock follow more than 200 days trandline resistance and break this trandline with strong bullish candel in daily TF with good volume.
also stock is follow support trandline with good respct.and aslo its PEMA(21,34,55) its turn to flat to sloping upside its best singh for long this stock
my lavels are enter to this stock
BUY = 204-205
TATGET = 210,220,230
STOP LOSS = 195
this stock follow more than 200 days trandline resistance and break this trandline with strong bullish candel in daily TF with good volume.
also stock is follow support trandline with good respct.and aslo its PEMA(21,34,55) its turn to flat to sloping upside its best singh for long this stock
my lavels are enter to this stock
BUY = 204-205
TATGET = 210,220,230
STOP LOSS = 195

면책사항
해당 정보와 게시물은 금융, 투자, 트레이딩 또는 기타 유형의 조언이나 권장 사항으로 간주되지 않으며, 트레이딩뷰에서 제공하거나 보증하는 것이 아닙니다. 자세한 내용은 이용 약관을 참조하세요.
면책사항
해당 정보와 게시물은 금융, 투자, 트레이딩 또는 기타 유형의 조언이나 권장 사항으로 간주되지 않으며, 트레이딩뷰에서 제공하거나 보증하는 것이 아닙니다. 자세한 내용은 이용 약관을 참조하세요.