
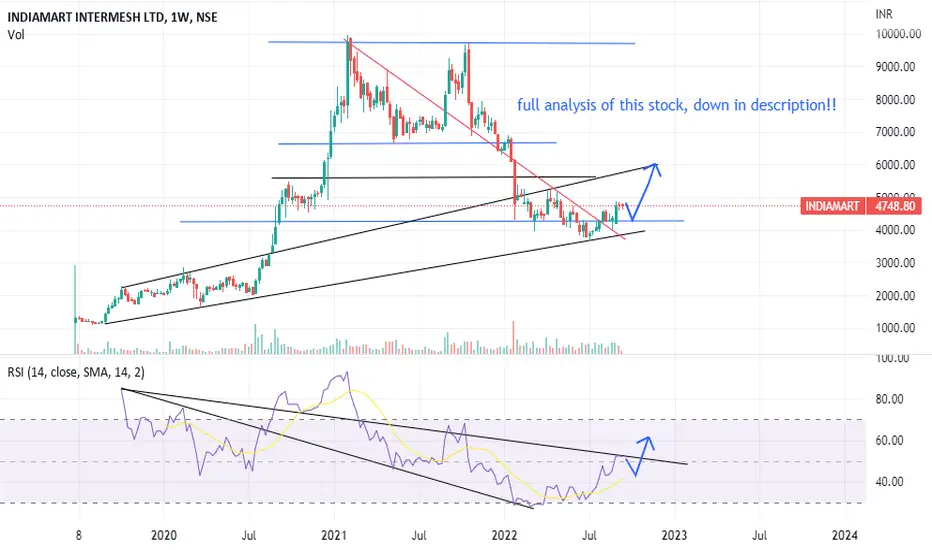
i have drawn some lines on rsi panel, which says- RSI's support and resistance. it does not mean that only price can have support and resistance. RSI is also a relative nature with price, so it can also have such trend line parts.
there is a less probabilty of falling more down.
my analysis-
rsi could take a rest on '45-47', then move upwards, price will take rest 'on the blue support line',
if the price falls down, or say it does not gives a breakout in rsi resistance line, then the price could reach its lowest support line(i.e, @3900), and rsi will go below 30, which will then show a rsi divergence from 7th march till the date when rsi went below 30. and this divergence cannot make the price more to fall(since the price would have reached its minimum support line). so the rules are not getting met.
therefore, the stock will rest at 4277, and then continue to move up, rsi will give a breakout.
one more point to add on, red trend line, shows that from he lowest point, the stock has given its breakout, so as the markets move upwards, stock will continue to go higher.
there is a less probabilty of falling more down.
my analysis-
rsi could take a rest on '45-47', then move upwards, price will take rest 'on the blue support line',
if the price falls down, or say it does not gives a breakout in rsi resistance line, then the price could reach its lowest support line(i.e, @3900), and rsi will go below 30, which will then show a rsi divergence from 7th march till the date when rsi went below 30. and this divergence cannot make the price more to fall(since the price would have reached its minimum support line). so the rules are not getting met.
therefore, the stock will rest at 4277, and then continue to move up, rsi will give a breakout.
one more point to add on, red trend line, shows that from he lowest point, the stock has given its breakout, so as the markets move upwards, stock will continue to go higher.

면책사항
해당 정보와 게시물은 금융, 투자, 트레이딩 또는 기타 유형의 조언이나 권장 사항으로 간주되지 않으며, 트레이딩뷰에서 제공하거나 보증하는 것이 아닙니다. 자세한 내용은 이용 약관을 참조하세요.
면책사항
해당 정보와 게시물은 금융, 투자, 트레이딩 또는 기타 유형의 조언이나 권장 사항으로 간주되지 않으며, 트레이딩뷰에서 제공하거나 보증하는 것이 아닙니다. 자세한 내용은 이용 약관을 참조하세요.