
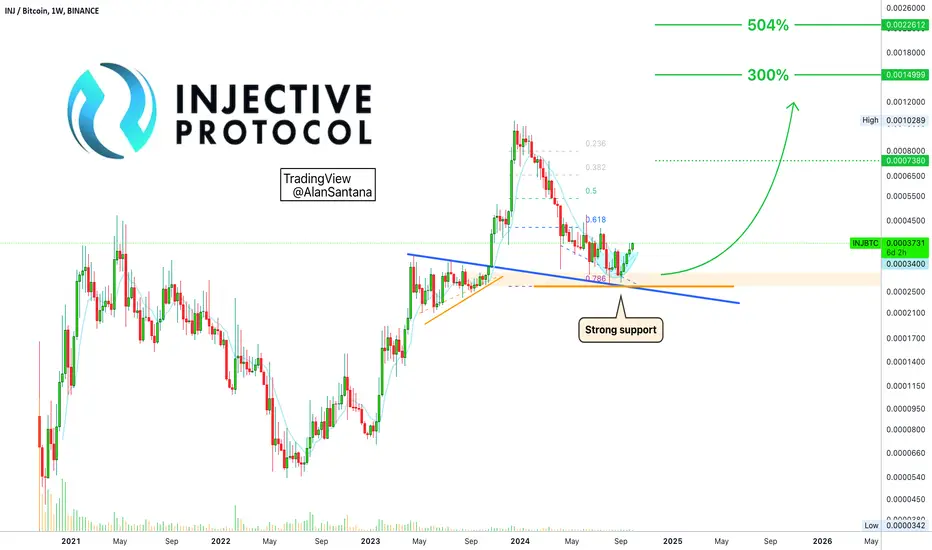
Let me start by saying that below "strong support," this is a difficult chart; bearish. But as long as Injective (INJBTC) trades above this level, 0.786 Fib. retracement and orange line, the setup is bullish.
This pair has been closing green five consecutive weeks, slowly moving higher. This is consolidation with a bullish bias.
This chart different to all others but there is some data that can help us see what is happening now.
➖ INJBTC stopped growing in December 2023, when Bitcoin entered bull-run mode.
➖ In June 2022 through November 2022, INJBTC recovered from a bottom low and produced a bullish wave.
➖ In June 2022 through November 2022, BTCUSD produced a lower low and bear-market bottom.
➖ INJBTC is now bullish. We have to consider each chart individually even if it looks hard, difficult or crazy, because the market moves in whatever way it wants.
➖ If Bitcoin were to move down now, INJBTC can easily move up.
➖ INJBTC is pointing up; BTCUSD is pointing down.
Whatever happens next, we don't know.
This chart is bullish and can be traded with a tight stop-loss.
Low risk, vs a high potential for reward.
Not a sure win, nothing is 100% certain.
It is simply a good/strong chart setup because it has a high probability for success.
Some trades we win.
Others trades we lose.
That's just the way it is.
Thank you for reading.
Namaste.
This pair has been closing green five consecutive weeks, slowly moving higher. This is consolidation with a bullish bias.
This chart different to all others but there is some data that can help us see what is happening now.
➖ INJBTC stopped growing in December 2023, when Bitcoin entered bull-run mode.
➖ In June 2022 through November 2022, INJBTC recovered from a bottom low and produced a bullish wave.
➖ In June 2022 through November 2022, BTCUSD produced a lower low and bear-market bottom.
➖ INJBTC is now bullish. We have to consider each chart individually even if it looks hard, difficult or crazy, because the market moves in whatever way it wants.
➖ If Bitcoin were to move down now, INJBTC can easily move up.
➖ INJBTC is pointing up; BTCUSD is pointing down.
Whatever happens next, we don't know.
This chart is bullish and can be traded with a tight stop-loss.
Low risk, vs a high potential for reward.
Not a sure win, nothing is 100% certain.
It is simply a good/strong chart setup because it has a high probability for success.
Some trades we win.
Others trades we lose.
That's just the way it is.
Thank you for reading.
Namaste.

✅ Cryptocurrencies technical analysis & results
t.me/masteranandatrades/9279
✅ Stocks technical analysis
t.me/anandastocks
✅ Enjoyed the content? Join my PREMIUM channels for more... t.me/lamatrades/4 (since 2017)
t.me/masteranandatrades/9279
✅ Stocks technical analysis
t.me/anandastocks
✅ Enjoyed the content? Join my PREMIUM channels for more... t.me/lamatrades/4 (since 2017)
관련 발행물
면책사항
해당 정보와 게시물은 금융, 투자, 트레이딩 또는 기타 유형의 조언이나 권장 사항으로 간주되지 않으며, 트레이딩뷰에서 제공하거나 보증하는 것이 아닙니다. 자세한 내용은 이용 약관을 참조하세요.
✅ Cryptocurrencies technical analysis & results
t.me/masteranandatrades/9279
✅ Stocks technical analysis
t.me/anandastocks
✅ Enjoyed the content? Join my PREMIUM channels for more... t.me/lamatrades/4 (since 2017)
t.me/masteranandatrades/9279
✅ Stocks technical analysis
t.me/anandastocks
✅ Enjoyed the content? Join my PREMIUM channels for more... t.me/lamatrades/4 (since 2017)
관련 발행물
면책사항
해당 정보와 게시물은 금융, 투자, 트레이딩 또는 기타 유형의 조언이나 권장 사항으로 간주되지 않으며, 트레이딩뷰에서 제공하거나 보증하는 것이 아닙니다. 자세한 내용은 이용 약관을 참조하세요.