
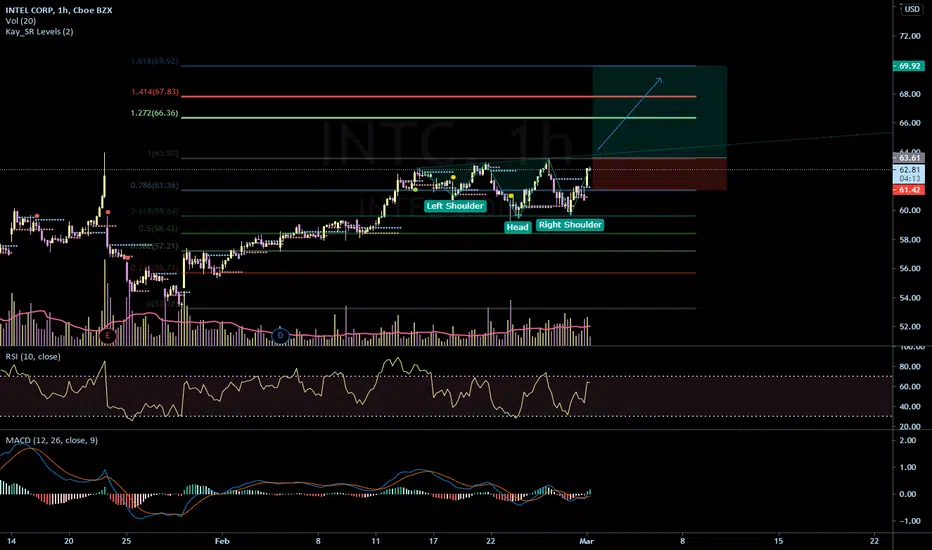
On the 1h chart INTC can be seen forming an inverse Head and Shoulders Pattern, or even a Double Bottom pattern. This is a very bullish sign, with the MACD transitioning into the green. If Intel successfully breaks the 63.57 line, it could go long having price targets of:
$66.30 - $67.80 - $70.00
In my opinion this looks like a very safe bull play on INTC. Always remember to buy the dip, thanks for viewing!
$66.30 - $67.80 - $70.00
In my opinion this looks like a very safe bull play on INTC. Always remember to buy the dip, thanks for viewing!

면책사항
해당 정보와 게시물은 금융, 투자, 트레이딩 또는 기타 유형의 조언이나 권장 사항으로 간주되지 않으며, 트레이딩뷰에서 제공하거나 보증하는 것이 아닙니다. 자세한 내용은 이용 약관을 참조하세요.
면책사항
해당 정보와 게시물은 금융, 투자, 트레이딩 또는 기타 유형의 조언이나 권장 사항으로 간주되지 않으며, 트레이딩뷰에서 제공하거나 보증하는 것이 아닙니다. 자세한 내용은 이용 약관을 참조하세요.