
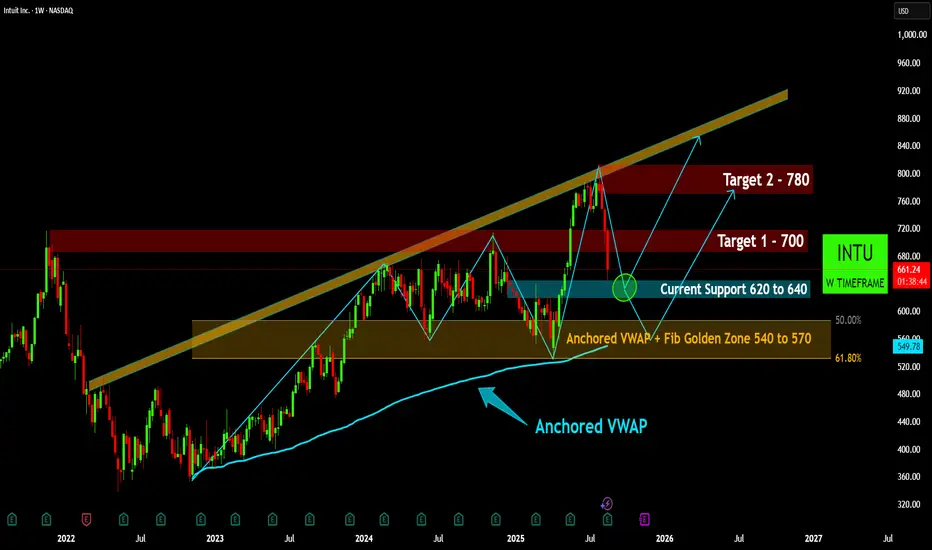
INTU Weekly: Testing Critical Support within Long-Term Uptrend
- INTU demonstrates a robust long-term bullish trend, consistently trading within an upward-sloping channel on the weekly timeframe since early 2023.
- Following a recent peak, the stock is currently testing the "Current Support" zone between
620-640, an important area for potential bounce and trend continuation. - Should the immediate support fail, a more significant and robust support confluence lies within the "Fib Golden Zone" (540-570), reinforced by the long-term Anchored VWAP.
- If current support holds, initial upside targets are identified at $700 (Target 1) and $780 (Target 2), with the potential to eventually re-test the upper boundary of the long-term channel.

면책사항
해당 정보와 게시물은 금융, 투자, 트레이딩 또는 기타 유형의 조언이나 권장 사항으로 간주되지 않으며, 트레이딩뷰에서 제공하거나 보증하는 것이 아닙니다. 자세한 내용은 이용 약관을 참조하세요.
면책사항
해당 정보와 게시물은 금융, 투자, 트레이딩 또는 기타 유형의 조언이나 권장 사항으로 간주되지 않으며, 트레이딩뷰에서 제공하거나 보증하는 것이 아닙니다. 자세한 내용은 이용 약관을 참조하세요.