
Technical Analysis & Chart Structure:
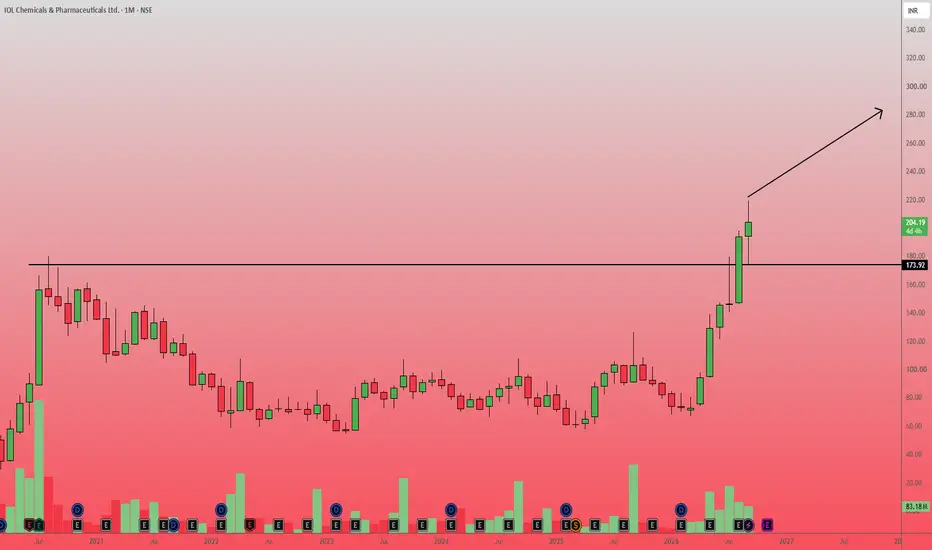
The monthly chart of IOL Chemicals & Pharmaceuticals Ltd. reveals a classic multi-year base formation and subsequent breakout.
After an extended period of consolidation spanning several years, the price has successfully breached a major horizontal resistance level marked at approximately 173.92.
This breakout is supported by strong bullish momentum, as evidenced by consecutive large green monthly candles.
Additionally, the volume profile at the bottom of the chart indicates increased buying interest participating in this upward move, giving validity to the breakout.
Trade Plan Setup:
Because this is a higher timeframe (monthly) chart, the setup is geared toward positional or swing traders rather than short-term momentum trading.
Entry Point: The stock is currently trading at 204.19.
An entry can be considered around current market price, or on a slight pullback/retest toward the breakout zone (180 - 190) to optimize the risk-to-reward ratio.
Target: Based on the depth of the consolidation base (measuring from the resistance at 174 down to the base lows near 60), a measured move projects a conservative initial target of 280 - 300.
If momentum sustains, secondary historical resistance levels near 340 can be tested.
Stop Loss: A strict stop loss should be placed below the breakout level to invalidate the setup if it turns out to be a fake breakout.
A weekly or monthly close below 165 (providing a buffer below the 173.92 support) would invalidate the bullish thesis.
The monthly chart of IOL Chemicals & Pharmaceuticals Ltd. reveals a classic multi-year base formation and subsequent breakout.
After an extended period of consolidation spanning several years, the price has successfully breached a major horizontal resistance level marked at approximately 173.92.
This breakout is supported by strong bullish momentum, as evidenced by consecutive large green monthly candles.
Additionally, the volume profile at the bottom of the chart indicates increased buying interest participating in this upward move, giving validity to the breakout.
Trade Plan Setup:
Because this is a higher timeframe (monthly) chart, the setup is geared toward positional or swing traders rather than short-term momentum trading.
Entry Point: The stock is currently trading at 204.19.
An entry can be considered around current market price, or on a slight pullback/retest toward the breakout zone (180 - 190) to optimize the risk-to-reward ratio.
Target: Based on the depth of the consolidation base (measuring from the resistance at 174 down to the base lows near 60), a measured move projects a conservative initial target of 280 - 300.
If momentum sustains, secondary historical resistance levels near 340 can be tested.
Stop Loss: A strict stop loss should be placed below the breakout level to invalidate the setup if it turns out to be a fake breakout.
A weekly or monthly close below 165 (providing a buffer below the 173.92 support) would invalidate the bullish thesis.

면책사항
해당 정보와 게시물은 금융, 투자, 트레이딩 또는 기타 유형의 조언이나 권장 사항으로 간주되지 않으며, 트레이딩뷰에서 제공하거나 보증하는 것이 아닙니다. 자세한 내용은 이용 약관을 참조하세요.
면책사항
해당 정보와 게시물은 금융, 투자, 트레이딩 또는 기타 유형의 조언이나 권장 사항으로 간주되지 않으며, 트레이딩뷰에서 제공하거나 보증하는 것이 아닙니다. 자세한 내용은 이용 약관을 참조하세요.