
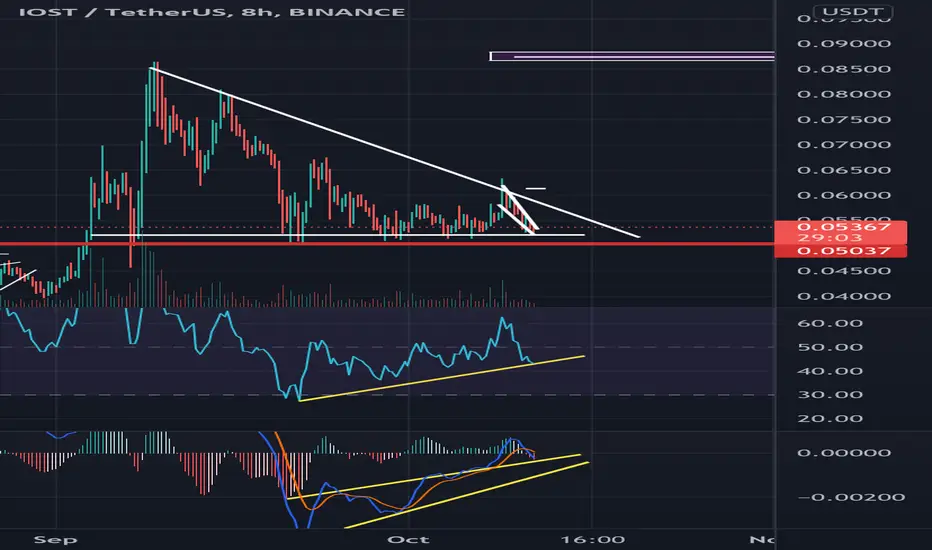
IOST at bottom of Triangle Pattern that has held the bottom above $0.05000 since 09/07/21. Exaggerated Divergence on 8 hour chart on MACD, RSI, and Histogram. Also in smaller falling wedge pattern on smaller time frame with brake out bringing price action out of triangle pattern to $0.06100. Probably see some resistance around there. Then possibly up to $0.085 plus.

면책사항
해당 정보와 게시물은 금융, 투자, 트레이딩 또는 기타 유형의 조언이나 권장 사항으로 간주되지 않으며, 트레이딩뷰에서 제공하거나 보증하는 것이 아닙니다. 자세한 내용은 이용 약관을 참조하세요.
면책사항
해당 정보와 게시물은 금융, 투자, 트레이딩 또는 기타 유형의 조언이나 권장 사항으로 간주되지 않으며, 트레이딩뷰에서 제공하거나 보증하는 것이 아닙니다. 자세한 내용은 이용 약관을 참조하세요.