
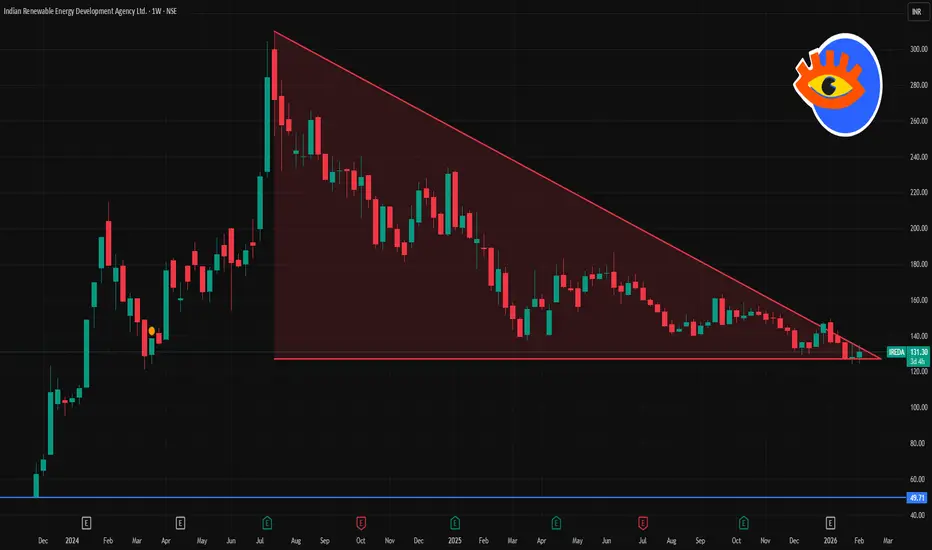
📌 Current Price Snapshot
👉 Latest available price data shows IREDA trading around ~₹130–₹135 on the NSE (end of January 2026) — this serves as the baseline for weekly levels.
📈 Weekly Technical Levels (Key Zones)
🚧 Weekly Resistance Levels (Upside)
Level Significance
₹136–₹138 Near‑term resistance — first obstacle for bulls this week.
₹138–₹140 Secondary resistance — key short‑term range top.
₹145–₹150 Major weekly resistance zone — breakout above this signals strength.
🛑 Weekly Support Levels (Downside)
Level Significance
₹130–₹131 Immediate weekly support area — crucial for holding near current price.
₹126–₹127 Secondary support — next cushion if price slips.
₹122–₹123 Strong support zone below — potential downside limit this week.
📉 Weekly Outlook Structure
Bullish Scenario
✅ If price closes above ~₹138–₹140 on the weekly chart → next upside target becomes ₹145–₹150. Continued strength above ₹150 would target even higher levels.
Bearish Scenario
❌ A weekly close below ~₹130–₹127 → opens the door to deeper support at ₹122–₹123.
📊 Momentum & Indicators
RSI near lower area suggests mild bearish momentum (not oversold yet).
The stock remains below key medium/long‑term EMAs, indicating ongoing downward bias unless a strong breakout occurs.
📌 Summary – Weekly Levels to Watch
Bullish Break Points
🔹 First Resist: ₹136–₹138
🔹 Next Resist: ₹138–₹140
🔹 Major Resist: ₹145–₹150
Bearish Support Points
🔸 First Support: ₹130–₹131
🔸 Next Support: ₹126–₹127
🔸 Strong Support: ₹122–₹123

Contact Knowledgehub for a detailed consultation: Dm on WhatsApp: [wa.link/a2o0kz]-
Phone No: [+91 93102 26243]-
Email: [tradingviewknowledgehub@gmail.com]---
-- Let’s achieve success together!
Phone No: [+91 93102 26243]-
Email: [tradingviewknowledgehub@gmail.com]---
-- Let’s achieve success together!
관련 발행물
면책사항
해당 정보와 게시물은 금융, 투자, 트레이딩 또는 기타 유형의 조언이나 권장 사항으로 간주되지 않으며, 트레이딩뷰에서 제공하거나 보증하는 것이 아닙니다. 자세한 내용은 이용 약관을 참조하세요.