
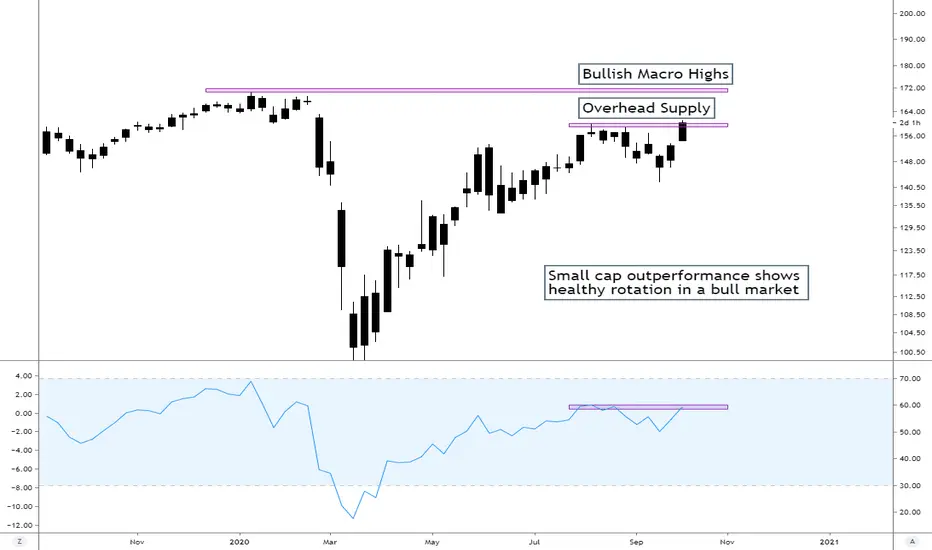
When looking at equities, there are always clues in the intermarket world. Today we will look at small caps breaking out. Let’s hop into the chart!
The first thing I notice here is the overhead supply that we have been struggling to break through. It now looks as though we have broken through. Now we just have to see if it is a fake out or a breakout. If we can turn this resistance into support over the next weeks, this will likely push the IWM to macro highs. The same goes on the RSI. If we can break this level of 60, we can see higher prices. If we are seeing small caps break out, that is a healthy sign of bull market rotation. Bull markets are hard to spot at the start, but this is something that we look for. By the way, small caps breaking out is good for equities and crypto, bad for bonds and the dollar. At least in the medium term of 6-12 months.
Happy Trading!

면책사항
해당 정보와 게시물은 금융, 투자, 트레이딩 또는 기타 유형의 조언이나 권장 사항으로 간주되지 않으며, 트레이딩뷰에서 제공하거나 보증하는 것이 아닙니다. 자세한 내용은 이용 약관을 참조하세요.
면책사항
해당 정보와 게시물은 금융, 투자, 트레이딩 또는 기타 유형의 조언이나 권장 사항으로 간주되지 않으며, 트레이딩뷰에서 제공하거나 보증하는 것이 아닙니다. 자세한 내용은 이용 약관을 참조하세요.