
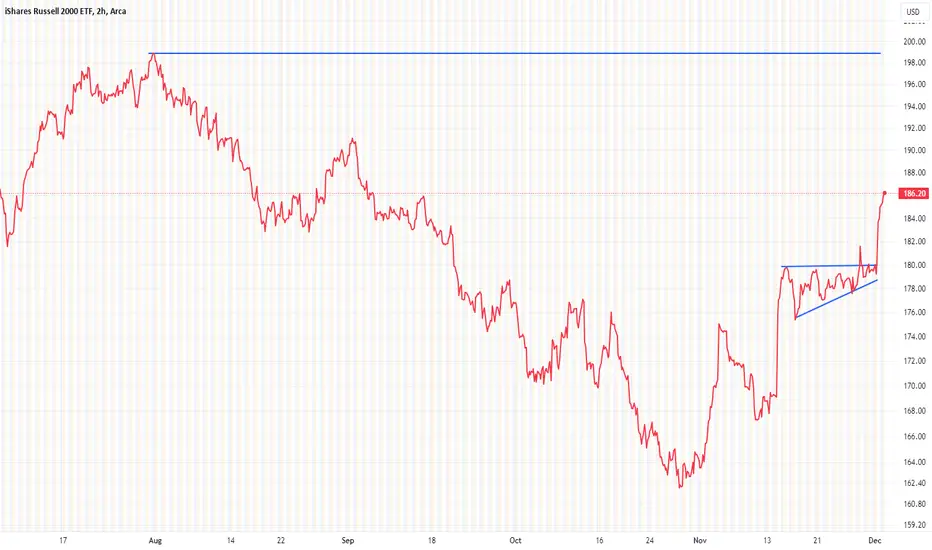
Small caps have sprung back to life. The iShares Russell 2000 ETF (IWM) fell nearly 20% from its July 31 recovery high to a multi-year low in October of $162, undercutting the June 2020 mark of $164. Today, the move back up to $186 might feel like too much, too fast, but I see things otherwise.
Notice in the chart that IWM actually went through a more than two-week stretch of trendless price action. Technicians like to see such periods of consolidation within uptrends as healthy signs of rest and recovery, often setting the stage for the next leg higher. That’s about what took place.
Printing above $186 this morning in the premarket, outperforming the S&P 500 and Nasdaq 100 futures which are in the red, the little guys of the market are once again spreading some pre-holiday cheer. The move comes under the radar, too, considering that the focus among traders is primarily on bitcoin and gold. I also find it encouraging that IWM is up despite a bout of selling pressure in the bond market today, pushing the 10-year Treasury yield up a few basis points.
I’ll be watching to see if IWM manages to retest the July highs at $198, up to the $202 area – a long-term resistance range dating back to Q3 2022.
Notice in the chart that IWM actually went through a more than two-week stretch of trendless price action. Technicians like to see such periods of consolidation within uptrends as healthy signs of rest and recovery, often setting the stage for the next leg higher. That’s about what took place.
Printing above $186 this morning in the premarket, outperforming the S&P 500 and Nasdaq 100 futures which are in the red, the little guys of the market are once again spreading some pre-holiday cheer. The move comes under the radar, too, considering that the focus among traders is primarily on bitcoin and gold. I also find it encouraging that IWM is up despite a bout of selling pressure in the bond market today, pushing the 10-year Treasury yield up a few basis points.
I’ll be watching to see if IWM manages to retest the July highs at $198, up to the $202 area – a long-term resistance range dating back to Q3 2022.

면책사항
해당 정보와 게시물은 금융, 투자, 트레이딩 또는 기타 유형의 조언이나 권장 사항으로 간주되지 않으며, 트레이딩뷰에서 제공하거나 보증하는 것이 아닙니다. 자세한 내용은 이용 약관을 참조하세요.
면책사항
해당 정보와 게시물은 금융, 투자, 트레이딩 또는 기타 유형의 조언이나 권장 사항으로 간주되지 않으며, 트레이딩뷰에서 제공하거나 보증하는 것이 아닙니다. 자세한 내용은 이용 약관을 참조하세요.