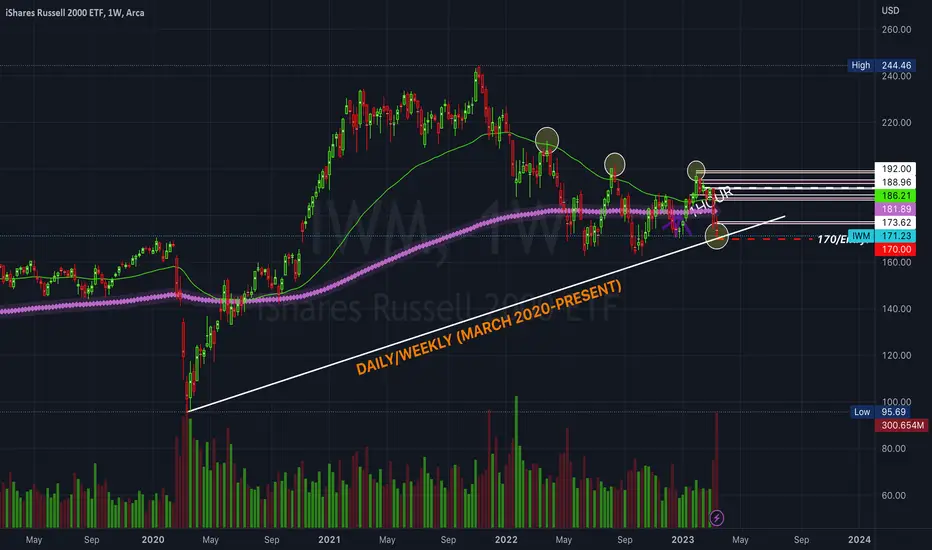
 IWM50 MA crossed down the 200 MA on the daily and 4H timeframe. The daily chart shows a lot of sellers. IWM also made lower highs on the weekly timeframe. Also, the exchange traded fund is resting on a trendline that it's maintained since March 2020! If we break down below 170 and it holds, IWM should see more downside. The weekly chart shows an increase of sellers between last week and this week. Last but not least, the etf shows a shooting star candle that printed on the weekly chart (March 13-17, 2023). Therefore, my plan is to short IWM below 170!
I will ride down IWM 170 (provided price gets there of course).
*This is not financial advice
Peace & Harmony,
MrALtrades00
노트
IWM also has a head and shoulders pattern on the daily timeframe! 
면책사항
해당 정보와 게시물은 금융, 투자, 트레이딩 또는 기타 유형의 조언이나 권장 사항으로 간주되지 않으며, 트레이딩뷰에서 제공하거나 보증하는 것이 아닙니다. 자세한 내용은 이용 약관을 참조하세요.
면책사항
해당 정보와 게시물은 금융, 투자, 트레이딩 또는 기타 유형의 조언이나 권장 사항으로 간주되지 않으며, 트레이딩뷰에서 제공하거나 보증하는 것이 아닙니다. 자세한 내용은 이용 약관을 참조하세요.