
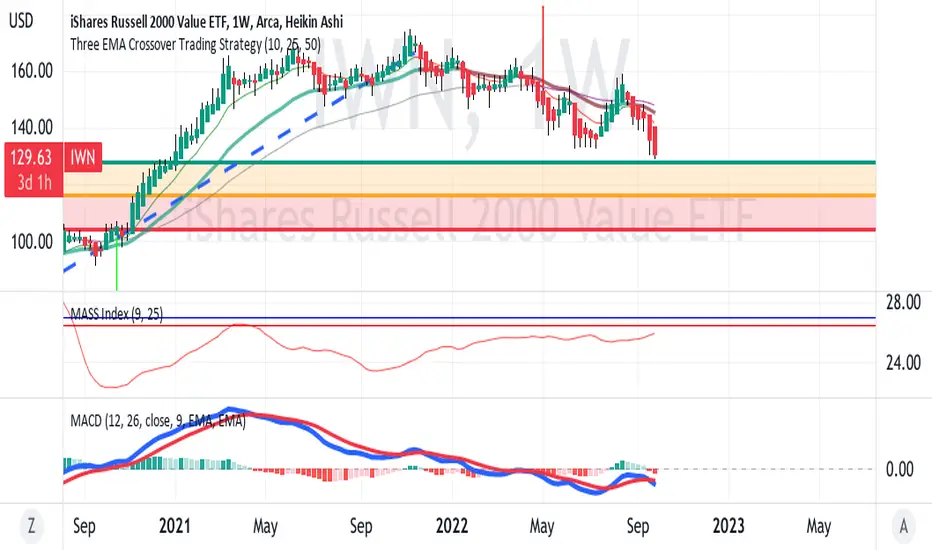
IWN as shown on the weekly chart has been obviously in a downtrend as also shown by
the EMA ribbon.
Using the uptrend from the Covid crash into November 2021 and then a retracement from that,
IWN is approchaing the 38.2 Fibonacci level at 128
From there it could bounce up or continue the downtrend.
The Mass Index being below 27 suggests a continuation before any potential reversal.
The MACD indicator shows the MACD in blue crossing down on the signal in red.
This also suggests more downtrend.
All in all, this analysis is bearish on the Russell index and its ETF.

면책사항
해당 정보와 게시물은 금융, 투자, 트레이딩 또는 기타 유형의 조언이나 권장 사항으로 간주되지 않으며, 트레이딩뷰에서 제공하거나 보증하는 것이 아닙니다. 자세한 내용은 이용 약관을 참조하세요.
면책사항
해당 정보와 게시물은 금융, 투자, 트레이딩 또는 기타 유형의 조언이나 권장 사항으로 간주되지 않으며, 트레이딩뷰에서 제공하거나 보증하는 것이 아닙니다. 자세한 내용은 이용 약관을 참조하세요.