
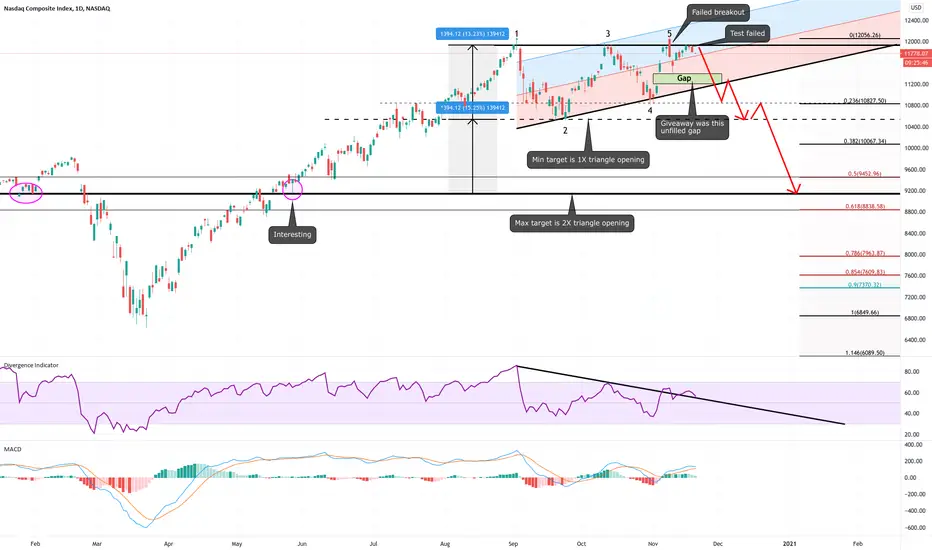
What I see is a failed breakout of an ascending triangle (not a bullish pennant). The NASDAQ tried for a week to get back up there and hold, but no dice. Thus, it becomes a bearish reversal pattern that typically signifies a top. Short of some more irrational FOMO (I am not completely discounting this), I think the NASDAQ is headed for a sizable correction. The other thing that leads me to believe this is the large gap up that was not filled and large indices like the NASDAQ always seem to fill gaps. See notes on chart.
Watch and see what it does when it reaches the center of the regression channel (break up or down). Also watch those thin black trend lines I drew.

Hope it helps and good luck.
Watch and see what it does when it reaches the center of the regression channel (break up or down). Also watch those thin black trend lines I drew.
Hope it helps and good luck.

관련 발행물
면책사항
해당 정보와 게시물은 금융, 투자, 트레이딩 또는 기타 유형의 조언이나 권장 사항으로 간주되지 않으며, 트레이딩뷰에서 제공하거나 보증하는 것이 아닙니다. 자세한 내용은 이용 약관을 참조하세요.
관련 발행물
면책사항
해당 정보와 게시물은 금융, 투자, 트레이딩 또는 기타 유형의 조언이나 권장 사항으로 간주되지 않으며, 트레이딩뷰에서 제공하거나 보증하는 것이 아닙니다. 자세한 내용은 이용 약관을 참조하세요.