
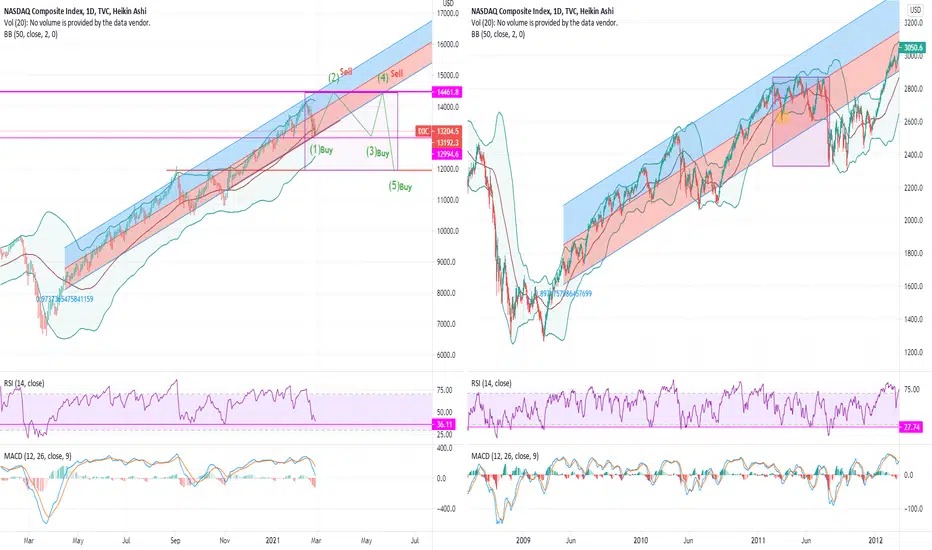
This is my favorite analysis
I give my qualified bid here on how NASDAQ and the market are going to evolve.
the graph is very similar to the financial crisis and makes exactly the same pattern, on top, bottom, RSI and MACD.
10-y bond have fallen and as I wrote in my other analysis, bonds will return to 0.95 and up again to 1.5. it's making a cup and handle now.
Follow the dates on the 1,2,3,4,5 wave and compare it with 10-y bond, and financial crisis(15. march 2011 to 17. june 2011).
I give my qualified bid here on how NASDAQ and the market are going to evolve.
the graph is very similar to the financial crisis and makes exactly the same pattern, on top, bottom, RSI and MACD.
10-y bond have fallen and as I wrote in my other analysis, bonds will return to 0.95 and up again to 1.5. it's making a cup and handle now.
Follow the dates on the 1,2,3,4,5 wave and compare it with 10-y bond, and financial crisis(15. march 2011 to 17. june 2011).

관련 발행물
면책사항
해당 정보와 게시물은 금융, 투자, 트레이딩 또는 기타 유형의 조언이나 권장 사항으로 간주되지 않으며, 트레이딩뷰에서 제공하거나 보증하는 것이 아닙니다. 자세한 내용은 이용 약관을 참조하세요.
면책사항
해당 정보와 게시물은 금융, 투자, 트레이딩 또는 기타 유형의 조언이나 권장 사항으로 간주되지 않으며, 트레이딩뷰에서 제공하거나 보증하는 것이 아닙니다. 자세한 내용은 이용 약관을 참조하세요.