
Good evening?
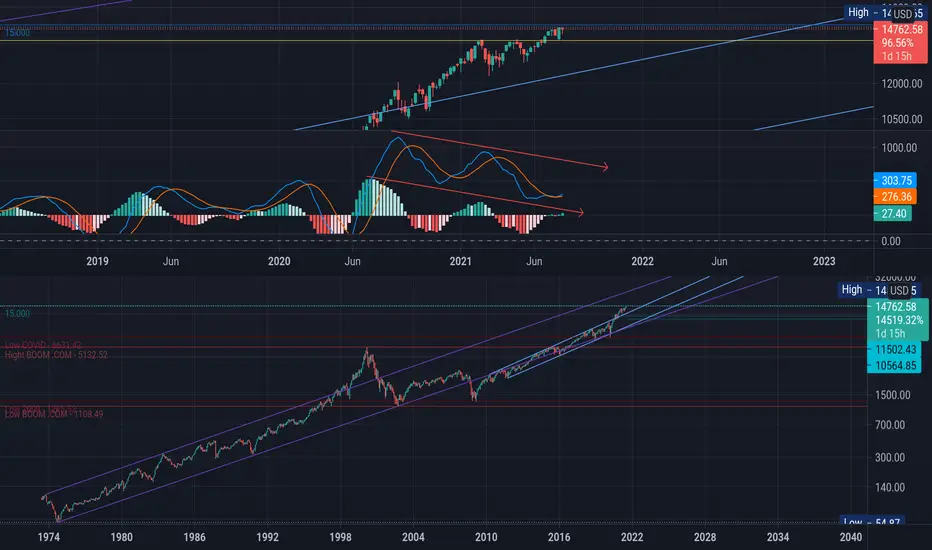
Signals to sell NASDAQ in general and BigTech shares in particular:
1. Round price of $ 15,000 = resistance.
2. Strong bearish MACD divergence on the weekly chart.
3. Beginning of bearish MACD divergence on slower monthly chart.
4. Bull trap - upward breakout of the resistance of the double top (yellow line).
Therefore, we can expect a Fibonacci correction from 30-50% to the $ 11.5k-10.5k range.
Not a financial recommendation.
GET RICH OR DIE TRYIN.
Signals to sell NASDAQ in general and BigTech shares in particular:
1. Round price of $ 15,000 = resistance.
2. Strong bearish MACD divergence on the weekly chart.
3. Beginning of bearish MACD divergence on slower monthly chart.
4. Bull trap - upward breakout of the resistance of the double top (yellow line).
Therefore, we can expect a Fibonacci correction from 30-50% to the $ 11.5k-10.5k range.
Not a financial recommendation.
GET RICH OR DIE TRYIN.

면책사항
해당 정보와 게시물은 금융, 투자, 트레이딩 또는 기타 유형의 조언이나 권장 사항으로 간주되지 않으며, 트레이딩뷰에서 제공하거나 보증하는 것이 아닙니다. 자세한 내용은 이용 약관을 참조하세요.
면책사항
해당 정보와 게시물은 금융, 투자, 트레이딩 또는 기타 유형의 조언이나 권장 사항으로 간주되지 않으며, 트레이딩뷰에서 제공하거나 보증하는 것이 아닙니다. 자세한 내용은 이용 약관을 참조하세요.