
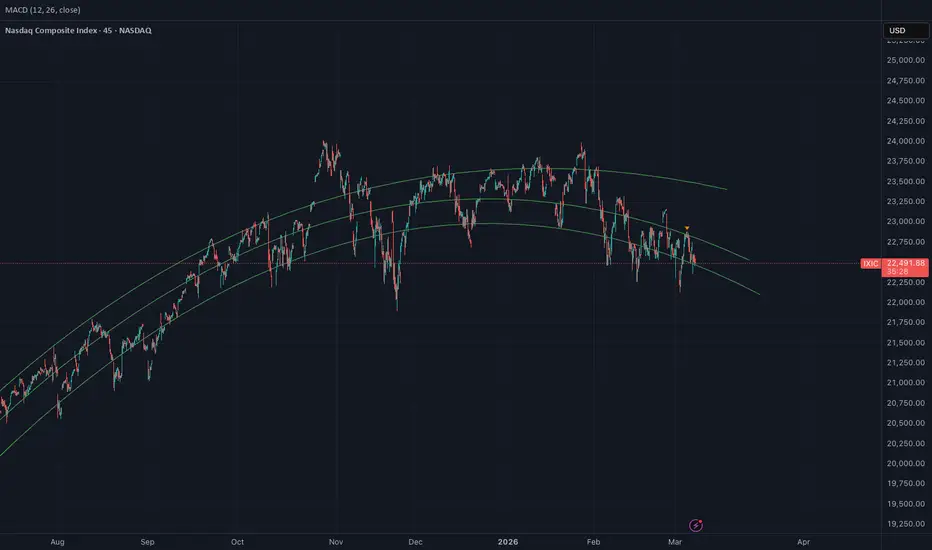
Technical analysis of the Nasdaq focuses on extracting structure from price, volatility, and liquidity rather than attempting to value companies directly. Because the Nasdaq is heavily weighted toward high-growth technology firms, its price behavior often exhibits strong momentum regimes, volatility clustering, and sharp liquidity-driven reversals. Analysts typically examine trend persistence through moving averages, market breadth indicators such as advance–decline lines, and momentum oscillators that capture shifts in buying pressure. Support and resistance zones—often reinforced by institutional positioning and options gamma exposure—tend to act as nonlinear boundaries where price either consolidates or accelerates. In practice, the objective is not prediction in a deterministic sense but probabilistic positioning: identifying areas where the asymmetry between potential upside and downside becomes statistically favorable based on historical price dynamics.

면책사항
해당 정보와 게시물은 금융, 투자, 트레이딩 또는 기타 유형의 조언이나 권장 사항으로 간주되지 않으며, 트레이딩뷰에서 제공하거나 보증하는 것이 아닙니다. 자세한 내용은 이용 약관을 참조하세요.
면책사항
해당 정보와 게시물은 금융, 투자, 트레이딩 또는 기타 유형의 조언이나 권장 사항으로 간주되지 않으며, 트레이딩뷰에서 제공하거나 보증하는 것이 아닙니다. 자세한 내용은 이용 약관을 참조하세요.