
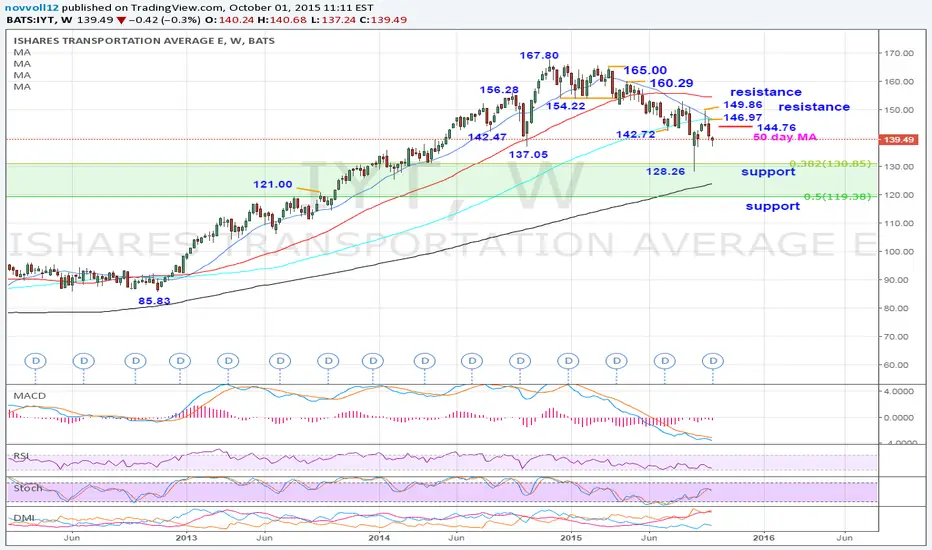
IYT 139.46 bearish – Potential to test August’s 128.26 low
IYT has been consolidating within the wide range between August’s 128.26 low (August 24, 2015) and the recovery high at 149.86 (September 14, 2015). Given the strong bearish momentum, there is potential to see a retest of the 128.26 low near 38.2% of the 70.82/167.80 (October 2011 low/November 2014 high) rise. Below lies the 200 week moving average currently at 123.69. The 142.72/146.97 resistance zone (July 6 low/September 21 high, 2015) which houses the 50 day moving average currently at 144.76 should cap bounces. Bulls must reclaim the area to stabilize the structure and improve the outlook for 149.86.
Outlook:
Daily: bearish
Weekly: neutral
IYT has been consolidating within the wide range between August’s 128.26 low (August 24, 2015) and the recovery high at 149.86 (September 14, 2015). Given the strong bearish momentum, there is potential to see a retest of the 128.26 low near 38.2% of the 70.82/167.80 (October 2011 low/November 2014 high) rise. Below lies the 200 week moving average currently at 123.69. The 142.72/146.97 resistance zone (July 6 low/September 21 high, 2015) which houses the 50 day moving average currently at 144.76 should cap bounces. Bulls must reclaim the area to stabilize the structure and improve the outlook for 149.86.
Outlook:
Daily: bearish
Weekly: neutral

면책사항
해당 정보와 게시물은 금융, 투자, 트레이딩 또는 기타 유형의 조언이나 권장 사항으로 간주되지 않으며, 트레이딩뷰에서 제공하거나 보증하는 것이 아닙니다. 자세한 내용은 이용 약관을 참조하세요.
면책사항
해당 정보와 게시물은 금융, 투자, 트레이딩 또는 기타 유형의 조언이나 권장 사항으로 간주되지 않으며, 트레이딩뷰에서 제공하거나 보증하는 것이 아닙니다. 자세한 내용은 이용 약관을 참조하세요.