
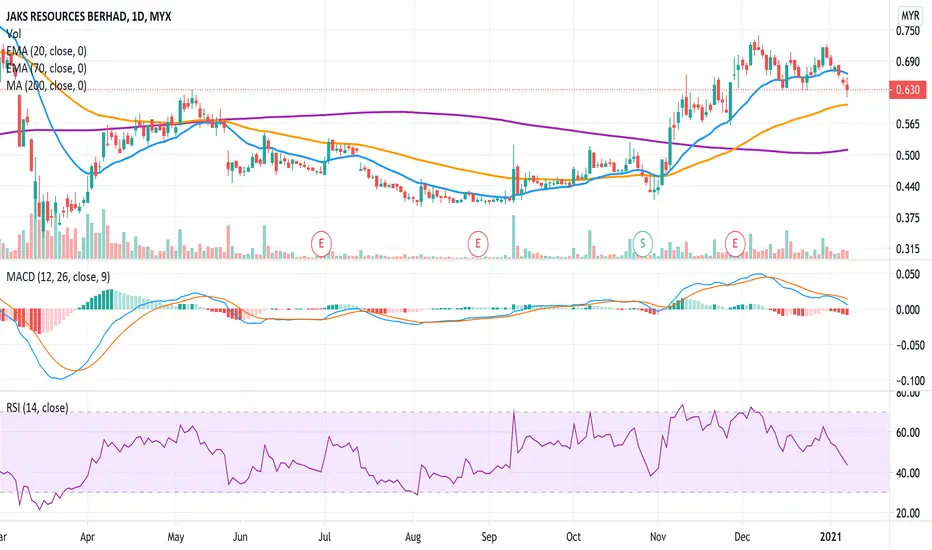
First I always look at the chart first, identify which market structure we are in?
Personally, I look at Jaks now currently breaking below EMA 20, while hovering around EMA 70, if broken it will head to around MYR 0.56 Support area.
Myr 0.56 Support area for Jaks will be a lower downside risks investment. Currently not suitable for entry while we continue to monitor. Momentum indicator also indicating Jaks losing momentum, Signalling exit!
I have learnt during my past mistakes that we should let the stock price comes to us, rather than us chasing the stock prices.
Kindly follow me more for value investing =) Lets keep learning together!
Personally, I look at Jaks now currently breaking below EMA 20, while hovering around EMA 70, if broken it will head to around MYR 0.56 Support area.
Myr 0.56 Support area for Jaks will be a lower downside risks investment. Currently not suitable for entry while we continue to monitor. Momentum indicator also indicating Jaks losing momentum, Signalling exit!
I have learnt during my past mistakes that we should let the stock price comes to us, rather than us chasing the stock prices.
Kindly follow me more for value investing =) Lets keep learning together!

면책사항
해당 정보와 게시물은 금융, 투자, 트레이딩 또는 기타 유형의 조언이나 권장 사항으로 간주되지 않으며, 트레이딩뷰에서 제공하거나 보증하는 것이 아닙니다. 자세한 내용은 이용 약관을 참조하세요.
면책사항
해당 정보와 게시물은 금융, 투자, 트레이딩 또는 기타 유형의 조언이나 권장 사항으로 간주되지 않으며, 트레이딩뷰에서 제공하거나 보증하는 것이 아닙니다. 자세한 내용은 이용 약관을 참조하세요.