What's up everyone, I'm back with some quick update on $JPM.
Quick fact: The 65-minute chart has 6 evenly sized candles (65 x 6 = 390, amt of mins per day).
Based on our previous analysis:
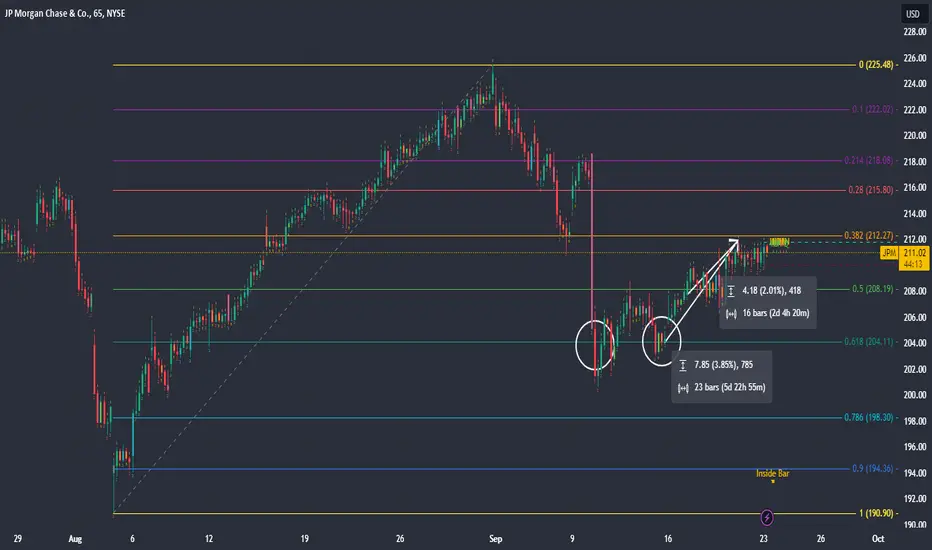
- JPM has bounced off the 0.618 bullish Fibonacci on the 65-minute chart at $204.11
- Price Target of $225.48 at 0.0 (assuming we continue the bullish trend)
- Stop Loss of $194.36 at the 0.9 bullish Fibonacci
The price is currently up 2% from when we first analyzed the stock and 3.85% from the last time it touched 0.618.
If you're in the play, stay the course, move your stop loss to 0.5 Fibonacci if you want to decrease your risk. If not, hold on.
I'm not in the play.
Quick fact: The 65-minute chart has 6 evenly sized candles (65 x 6 = 390, amt of mins per day).
Based on our previous analysis:
-
JPM has bounced off the 0.618 bullish Fibonacci on the 65-minute chart at $204.11- Price Target of $225.48 at 0.0 (assuming we continue the bullish trend)
- Stop Loss of $194.36 at the 0.9 bullish Fibonacci
The price is currently up 2% from when we first analyzed the stock and 3.85% from the last time it touched 0.618.
If you're in the play, stay the course, move your stop loss to 0.5 Fibonacci if you want to decrease your risk. If not, hold on.
I'm not in the play.

관련 발행물
면책사항
해당 정보와 게시물은 금융, 투자, 트레이딩 또는 기타 유형의 조언이나 권장 사항으로 간주되지 않으며, 트레이딩뷰에서 제공하거나 보증하는 것이 아닙니다. 자세한 내용은 이용 약관을 참조하세요.
면책사항
해당 정보와 게시물은 금융, 투자, 트레이딩 또는 기타 유형의 조언이나 권장 사항으로 간주되지 않으며, 트레이딩뷰에서 제공하거나 보증하는 것이 아닙니다. 자세한 내용은 이용 약관을 참조하세요.