
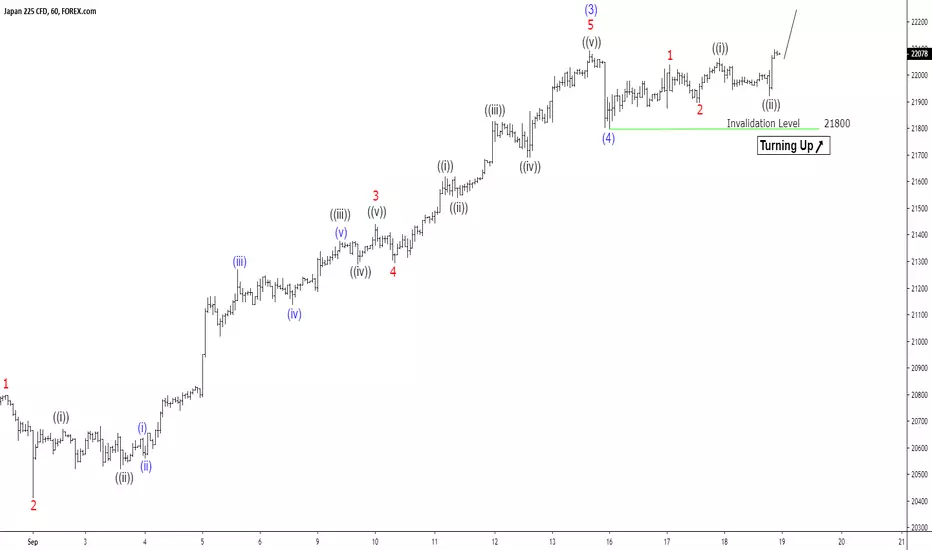
Elliott Wave view suggests the rally in Nikkei from August 26, 2019 low is unfolding as an impulse Elliott Wave structure. In the 1 hour chart below, the rally to 21890 on September 13, 2019 ended wave (3) and wave (4) pullback. Internal of wave (3) unfolded as an impulse in lesser degree. Wave 1 of (3) ended at 20800 and wave 2 of (3) ended at 20416. Up from there, wave 3 of (3) ended at 21455, wave 4 of (3) ended at 21295, and wave 5 of (3) ended at 22095.
Near term, the cycle is mature and thus it’s risky to chase the rally at this stage. However, while near term pullback stays above 21800, further upside can’t be ruled out within wave (5).
Near term, the cycle is mature and thus it’s risky to chase the rally at this stage. However, while near term pullback stays above 21800, further upside can’t be ruled out within wave (5).

면책사항
해당 정보와 게시물은 금융, 투자, 트레이딩 또는 기타 유형의 조언이나 권장 사항으로 간주되지 않으며, 트레이딩뷰에서 제공하거나 보증하는 것이 아닙니다. 자세한 내용은 이용 약관을 참조하세요.
면책사항
해당 정보와 게시물은 금융, 투자, 트레이딩 또는 기타 유형의 조언이나 권장 사항으로 간주되지 않으며, 트레이딩뷰에서 제공하거나 보증하는 것이 아닙니다. 자세한 내용은 이용 약관을 참조하세요.