

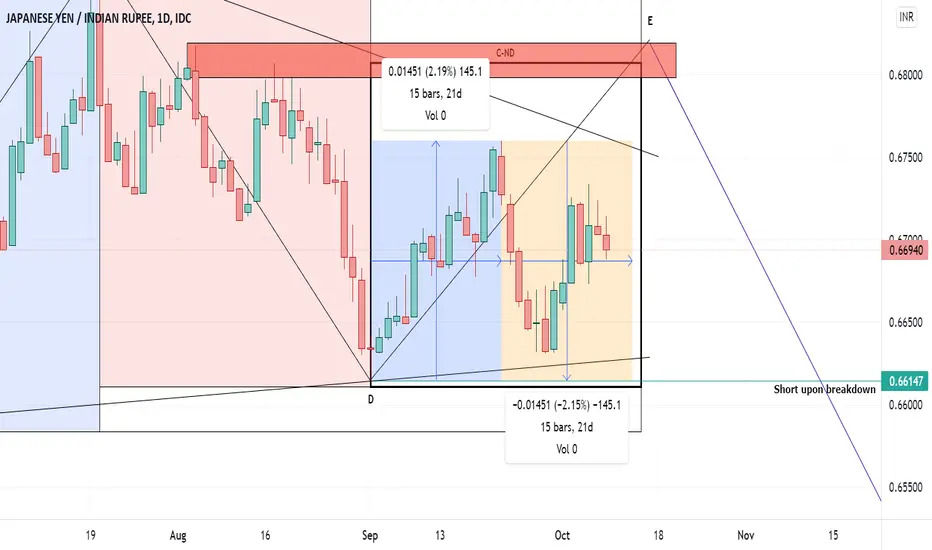
In continuation to the linked idea titled as "Update 1-JPY/INR", this post explains what's going on in wave E.

In the above chart there are 2 shaded areas in wave E indicated inside bold black bordered box.
Blue shaded area is the price action to the upside and the orange one is to the downside.
If the price action in the orange shaded area breaks below the blue shaded area on or before 13/10/2021 then it keeps a full stop to the whole correction by completing wave E and the triangle and the downtrend continues else the price action inside the orange area is a corrective wave to the one in blue area.
Keep watching this space for further updates.
To understand the concepts behind my analysis please checkout the linked idea. Happy trading :)
In the above chart there are 2 shaded areas in wave E indicated inside bold black bordered box.
Blue shaded area is the price action to the upside and the orange one is to the downside.
If the price action in the orange shaded area breaks below the blue shaded area on or before 13/10/2021 then it keeps a full stop to the whole correction by completing wave E and the triangle and the downtrend continues else the price action inside the orange area is a corrective wave to the one in blue area.
Keep watching this space for further updates.
To understand the concepts behind my analysis please checkout the linked idea. Happy trading :)

관련 발행물
면책사항
해당 정보와 게시물은 금융, 투자, 트레이딩 또는 기타 유형의 조언이나 권장 사항으로 간주되지 않으며, 트레이딩뷰에서 제공하거나 보증하는 것이 아닙니다. 자세한 내용은 이용 약관을 참조하세요.
면책사항
해당 정보와 게시물은 금융, 투자, 트레이딩 또는 기타 유형의 조언이나 권장 사항으로 간주되지 않으며, 트레이딩뷰에서 제공하거나 보증하는 것이 아닙니다. 자세한 내용은 이용 약관을 참조하세요.