
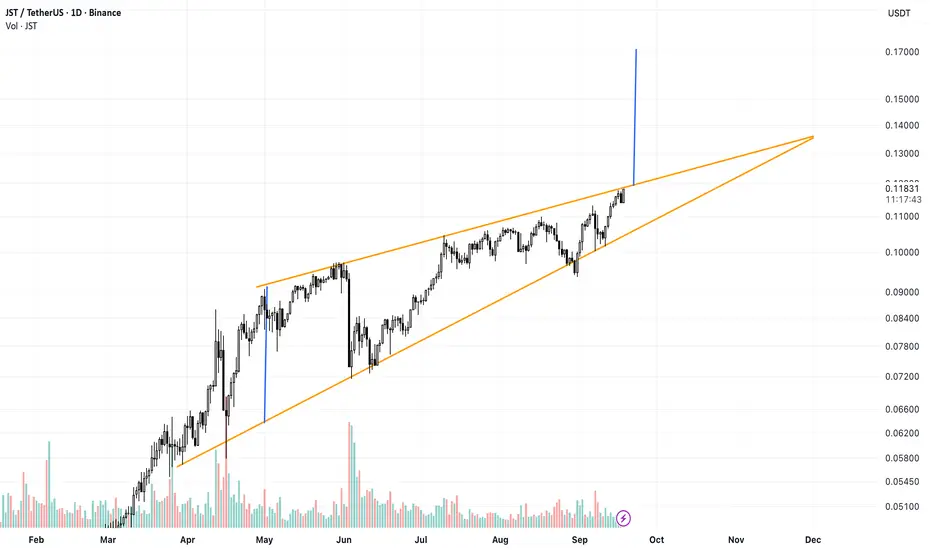
JST/USDT is trading inside a large rising wedge on the 1D chart, with price forming higher highs and higher lows while both trendlines gradually converge. Price is now testing the upper boundary around $0.118–$0.120 after another strong push from the lower support.
A confirmed daily breakout and hold above the upper trendline could trigger a bullish expansion toward the $0.165–$0.170 target area. However, because a rising wedge is traditionally a bearish structure, a rejection from the upper boundary followed by a breakdown below the rising support would weaken the bullish scenario and increase the probability of a deeper correction.
A confirmed daily breakout and hold above the upper trendline could trigger a bullish expansion toward the $0.165–$0.170 target area. However, because a rising wedge is traditionally a bearish structure, a rejection from the upper boundary followed by a breakdown below the rising support would weaken the bullish scenario and increase the probability of a deeper correction.

면책사항
해당 정보와 게시물은 금융, 투자, 트레이딩 또는 기타 유형의 조언이나 권장 사항으로 간주되지 않으며, 트레이딩뷰에서 제공하거나 보증하는 것이 아닙니다. 자세한 내용은 이용 약관을 참조하세요.
면책사항
해당 정보와 게시물은 금융, 투자, 트레이딩 또는 기타 유형의 조언이나 권장 사항으로 간주되지 않으며, 트레이딩뷰에서 제공하거나 보증하는 것이 아닙니다. 자세한 내용은 이용 약관을 참조하세요.