롱
Trending Kellog
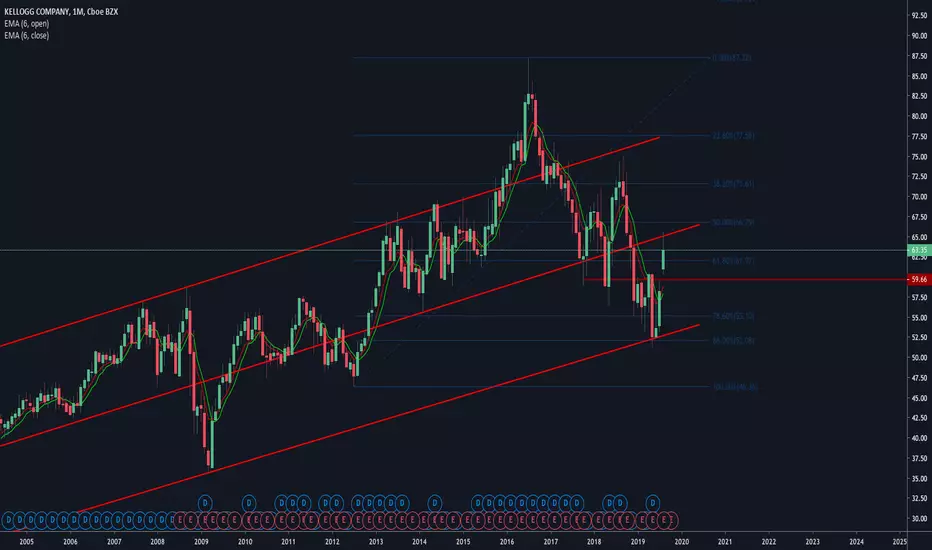
Chart Analysis
It's a bit late, but we see on weekly and monthly chart that $NYSE:K made a nice turn on long term trendline.
Last week the chart formed a nice low around the Fibonacci 78.6.
Of course, we missed the low, but maybe we get a second chance around 60$ to enter.
Dividend
3.6% dividend
Payout ratio 58%
14 years Dividend Growth
It's a bit late, but we see on weekly and monthly chart that $NYSE:K made a nice turn on long term trendline.
Last week the chart formed a nice low around the Fibonacci 78.6.
Of course, we missed the low, but maybe we get a second chance around 60$ to enter.
Dividend
3.6% dividend
Payout ratio 58%
14 years Dividend Growth

면책사항
해당 정보와 게시물은 금융, 투자, 트레이딩 또는 기타 유형의 조언이나 권장 사항으로 간주되지 않으며, 트레이딩뷰에서 제공하거나 보증하는 것이 아닙니다. 자세한 내용은 이용 약관을 참조하세요.
면책사항
해당 정보와 게시물은 금융, 투자, 트레이딩 또는 기타 유형의 조언이나 권장 사항으로 간주되지 않으며, 트레이딩뷰에서 제공하거나 보증하는 것이 아닙니다. 자세한 내용은 이용 약관을 참조하세요.