An Uptrend Pattern!
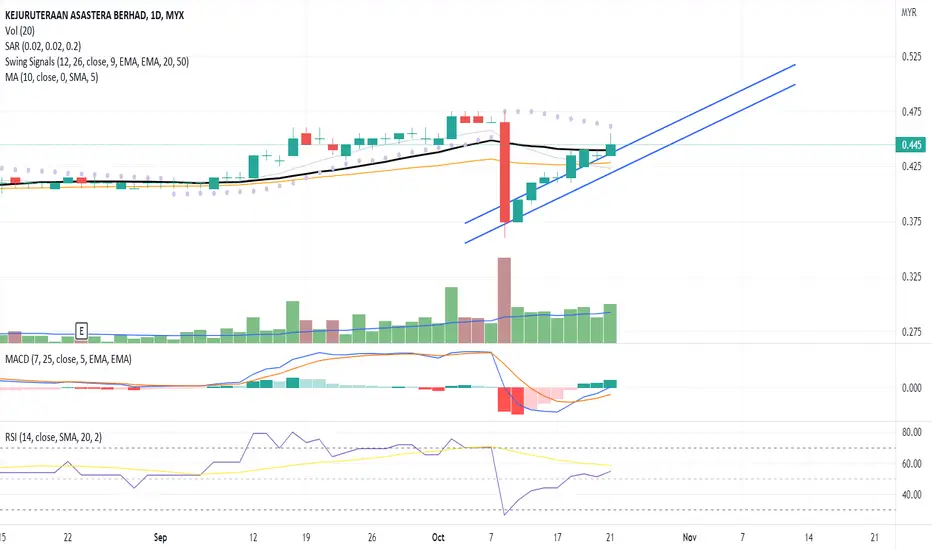
The candlestick pattern indicates a continuous price uptrend towards the MA20 line backed with high volume.
Precaution because the last candlestick indicates a "shooting star" candle, hence, the probability of price correction between the trendline channel or potential resistance area around the price range of the candle.
The MACD confirms the price uptrend towards the next price resistance.
The RSI indicates a fresh buying interest in the stock.
Let's put KAB in WL and watch out for continuous price movement toward the next price resistance backed with volume.
R 0.470
S 0.425
Precaution because the last candlestick indicates a "shooting star" candle, hence, the probability of price correction between the trendline channel or potential resistance area around the price range of the candle.
The MACD confirms the price uptrend towards the next price resistance.
The RSI indicates a fresh buying interest in the stock.
Let's put KAB in WL and watch out for continuous price movement toward the next price resistance backed with volume.
R 0.470
S 0.425

면책사항
해당 정보와 게시물은 금융, 투자, 트레이딩 또는 기타 유형의 조언이나 권장 사항으로 간주되지 않으며, 트레이딩뷰에서 제공하거나 보증하는 것이 아닙니다. 자세한 내용은 이용 약관을 참조하세요.
면책사항
해당 정보와 게시물은 금융, 투자, 트레이딩 또는 기타 유형의 조언이나 권장 사항으로 간주되지 않으며, 트레이딩뷰에서 제공하거나 보증하는 것이 아닙니다. 자세한 내용은 이용 약관을 참조하세요.