
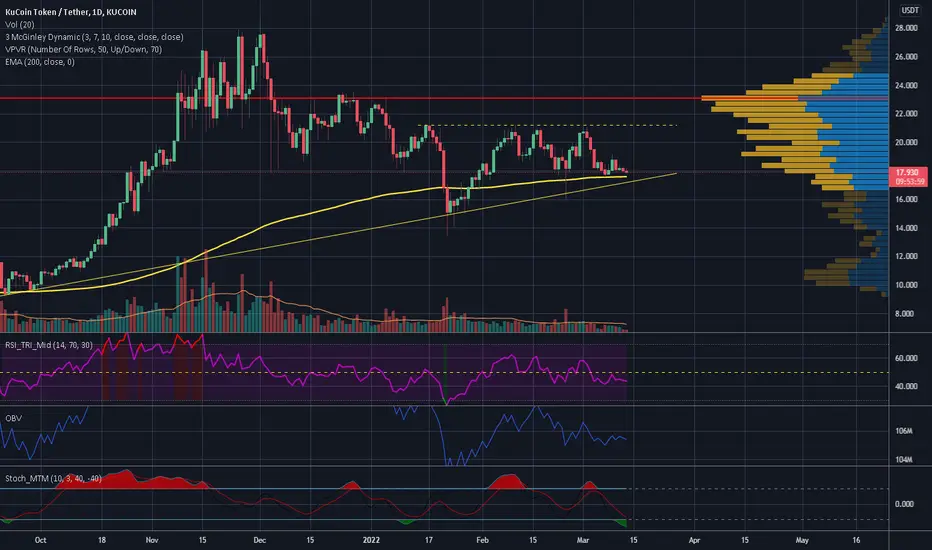
KCS has been hitting a resistance since 16th of January but with time EMA 200 rose and price it's now enclosed between that and the resistance at 21.192 USDT. From a chart pattern point ov view this appears like a rising asymetrical triangle and even the fact that volume is decreaseing could be in line with a possible upcoming breakup which is a very good bullish pattern but overall indicators are uncertain.
I think you could start DCA if price hit lower support and bounce back OVER EMA 200, and despite this you should use a stop loss anyway considering the current market situation. Right now I wouldn't give anything for accounted.
If instead it breaks downwards you might look for shorting opportunities (I'll post some updates if I can).
Our number one rule now must be not risking anything and avoid to remain trapped with some bags (trust me I speak by personal experience).
Good luck

면책사항
해당 정보와 게시물은 금융, 투자, 트레이딩 또는 기타 유형의 조언이나 권장 사항으로 간주되지 않으며, 트레이딩뷰에서 제공하거나 보증하는 것이 아닙니다. 자세한 내용은 이용 약관을 참조하세요.
면책사항
해당 정보와 게시물은 금융, 투자, 트레이딩 또는 기타 유형의 조언이나 권장 사항으로 간주되지 않으며, 트레이딩뷰에서 제공하거나 보증하는 것이 아닙니다. 자세한 내용은 이용 약관을 참조하세요.