
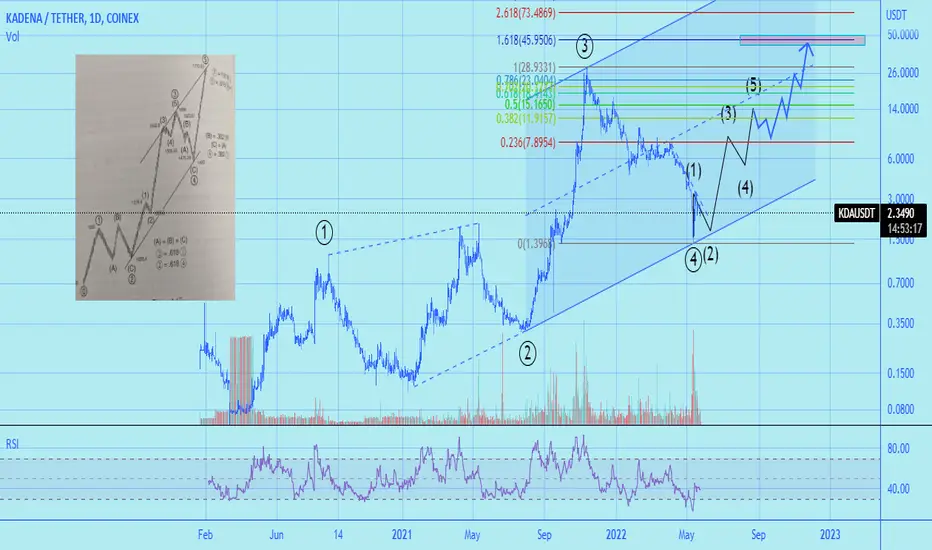
So I've been casually browsing the book "Elliott wave principle" by A.J. Frost (a must have, btw) and came across this sample.
Remarkable how similar these two charts are (hope you see it the pic due to me being on a laptop). It's quite striking that the 5th wave isn't done yet. So if this is to be true, profit-taking target, according to the book, is at 1.618 Fib or ~$45.
Wave 2 - flat; Wave 4 - zigzag -> meaning EW alternation is valid.
Current situation and plan
interpretation of current structure is a possibility of us being in the 2nd wave of the first wave in this last leg up. Expecting more downside and hit of the lower channel line. If not, cool.
노트
Adam and Eve bottom forming? Watch out for a potential rounded bottom now i.e. Eve.
면책사항
해당 정보와 게시물은 금융, 투자, 트레이딩 또는 기타 유형의 조언이나 권장 사항으로 간주되지 않으며, 트레이딩뷰에서 제공하거나 보증하는 것이 아닙니다. 자세한 내용은 이용 약관을 참조하세요.
면책사항
해당 정보와 게시물은 금융, 투자, 트레이딩 또는 기타 유형의 조언이나 권장 사항으로 간주되지 않으며, 트레이딩뷰에서 제공하거나 보증하는 것이 아닙니다. 자세한 내용은 이용 약관을 참조하세요.