
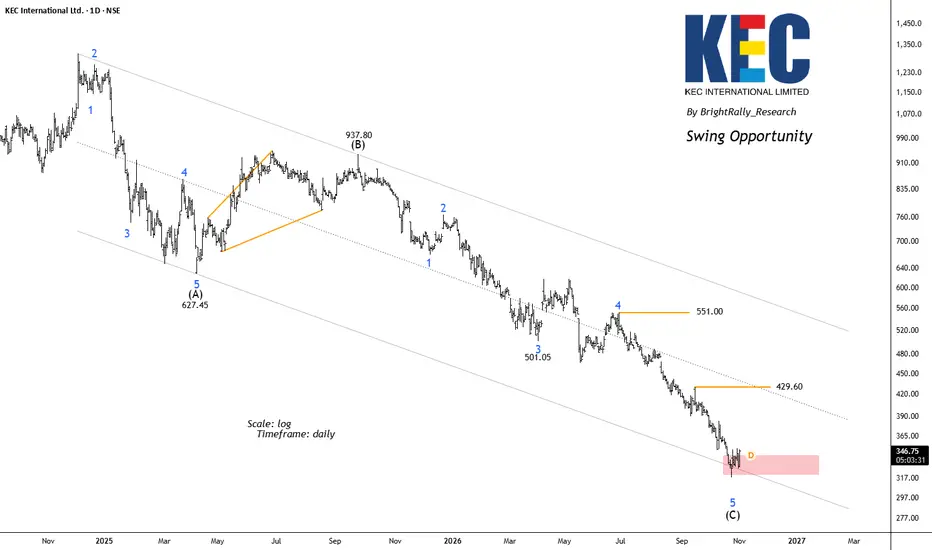
KEC International has been trading inside a broad descending channel, reflecting a prolonged corrective phase. The Elliott Wave structure suggests that the stock may be approaching the final stages of a larger Wave (C) decline.
The chart shows Wave (A) ending near ₹627.45, followed by a recovery into Wave (B) near ₹937.80. Since then, the stock has continued its downward journey in a developing Wave (C) structure.
The recent decline appears to be completing Wave 5, with the price now entering an important demand zone around ₹317.25. The latest daily candle has shown a positive move, which could indicate early buying interest.
Key levels to watch
- Immediate support: ₹317
- First resistance: ₹429.60
- Major resistance: ₹551
Swing outlook
KEC is approaching a technically important area where a relief rally or swing recovery could develop. A sustained move above ₹429.60 would strengthen the recovery scenario and bring ₹551 into focus.
However, the broader trend remains bearish, so a positive candle alone is not enough to confirm a reversal. A decisive break below ₹317.25 would weaken the bullish setup and suggest that the correction may continue.
BrightRally_Research on TradingView
The chart shows Wave (A) ending near ₹627.45, followed by a recovery into Wave (B) near ₹937.80. Since then, the stock has continued its downward journey in a developing Wave (C) structure.
The recent decline appears to be completing Wave 5, with the price now entering an important demand zone around ₹317.25. The latest daily candle has shown a positive move, which could indicate early buying interest.
Key levels to watch
- Immediate support: ₹317
- First resistance: ₹429.60
- Major resistance: ₹551
Swing outlook
KEC is approaching a technically important area where a relief rally or swing recovery could develop. A sustained move above ₹429.60 would strengthen the recovery scenario and bring ₹551 into focus.
However, the broader trend remains bearish, so a positive candle alone is not enough to confirm a reversal. A decisive break below ₹317.25 would weaken the bullish setup and suggest that the correction may continue.
BrightRally_Research on TradingView
액티브 트레이드
Will update the chart when the reversal is taking place. Stay tuned!
관련 발행물
면책사항
해당 정보와 게시물은 금융, 투자, 트레이딩 또는 기타 유형의 조언이나 권장 사항으로 간주되지 않으며, 트레이딩뷰에서 제공하거나 보증하는 것이 아닙니다. 자세한 내용은 이용 약관을 참조하세요.
관련 발행물
면책사항
해당 정보와 게시물은 금융, 투자, 트레이딩 또는 기타 유형의 조언이나 권장 사항으로 간주되지 않으며, 트레이딩뷰에서 제공하거나 보증하는 것이 아닙니다. 자세한 내용은 이용 약관을 참조하세요.