
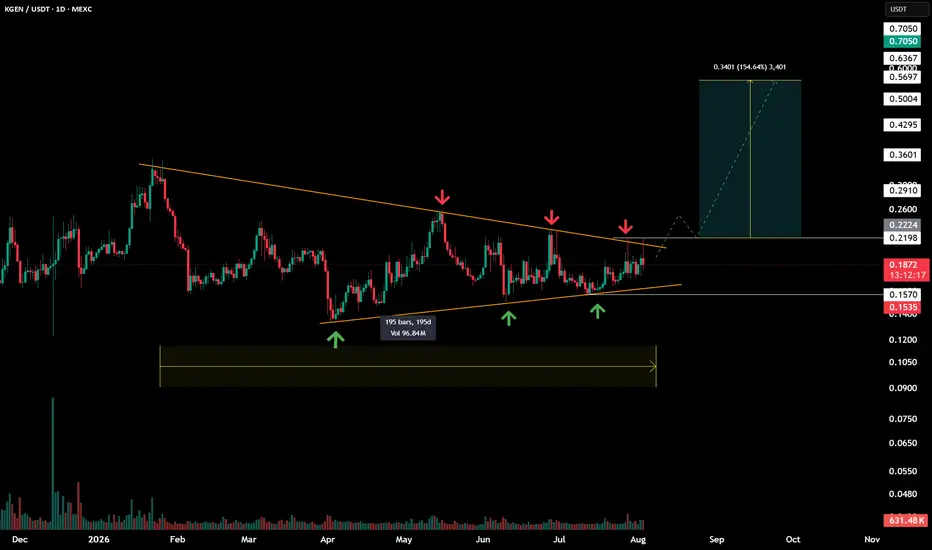
195-Day Wedge Compression: Big Breakout Loading?
Overview
Price has been consolidating inside a massive Symmetrical / Falling Wedge pattern for the past 195 days. We are now approaching the apex of this compression, where a major directional move typically unfolds.
Technical Breakdown
Strong Confluence: The upper resistance (red arrows) and lower support (green arrows) have been tested multiple times over the last six months, validating this market structure.
Key Support Zone: The $0.1535 – $0.1570 range continues to act as a rock-solid floor for buyers.
Breakout Trigger: The main hurdle for the bulls lies between $0.2000 and $0.2200. A daily candle close above this level confirms the breakout.
Trade Plan & Targets
Confirmation Entry: Wait for a breakout and retest of the $0.2200 resistance-turned-support zone.
Upside Target: The measured move of the pattern points toward a potential ~150%+ rally, targeting the major resistance at $0.7050.
Target 1: $0.3600
Target 2: $0.5000
Final Target: $0.7050
Risk Management
Invalidation / Stop Loss: A daily close below the $0.1535 support level invalidates this bullish scenario.
Disclaimer: This analysis is for educational purposes only and not financial advice. Always manage your risk!
Overview
Price has been consolidating inside a massive Symmetrical / Falling Wedge pattern for the past 195 days. We are now approaching the apex of this compression, where a major directional move typically unfolds.
Technical Breakdown
Strong Confluence: The upper resistance (red arrows) and lower support (green arrows) have been tested multiple times over the last six months, validating this market structure.
Key Support Zone: The $0.1535 – $0.1570 range continues to act as a rock-solid floor for buyers.
Breakout Trigger: The main hurdle for the bulls lies between $0.2000 and $0.2200. A daily candle close above this level confirms the breakout.
Trade Plan & Targets
Confirmation Entry: Wait for a breakout and retest of the $0.2200 resistance-turned-support zone.
Upside Target: The measured move of the pattern points toward a potential ~150%+ rally, targeting the major resistance at $0.7050.
Target 1: $0.3600
Target 2: $0.5000
Final Target: $0.7050
Risk Management
Invalidation / Stop Loss: A daily close below the $0.1535 support level invalidates this bullish scenario.
Disclaimer: This analysis is for educational purposes only and not financial advice. Always manage your risk!

면책사항
해당 정보와 게시물은 금융, 투자, 트레이딩 또는 기타 유형의 조언이나 권장 사항으로 간주되지 않으며, 트레이딩뷰에서 제공하거나 보증하는 것이 아닙니다. 자세한 내용은 이용 약관을 참조하세요.
면책사항
해당 정보와 게시물은 금융, 투자, 트레이딩 또는 기타 유형의 조언이나 권장 사항으로 간주되지 않으며, 트레이딩뷰에서 제공하거나 보증하는 것이 아닙니다. 자세한 내용은 이용 약관을 참조하세요.