업데이트됨
Upcoming action?
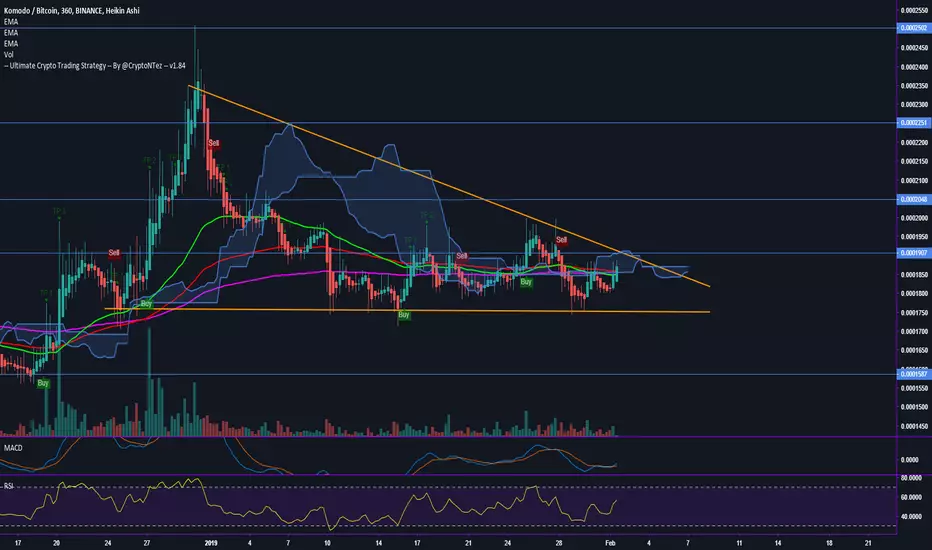
We may see some action in the following days Currently showing a structure that looks like a descending triangle but upcoming events turn me to think that this will break to the upside.
MACD bullcross and RSI rising, EMA50-100-200 almost all together #KMD
Targets both to the upside and downside are on the chart. The alert from the UCTS bring me to this chart since a buy signal is flashing time to time, that is one way that the tool can help you to filter noise from markets and check only that charts where something is happening
MACD bullcross and RSI rising, EMA50-100-200 almost all together #KMD
Targets both to the upside and downside are on the chart. The alert from the UCTS bring me to this chart since a buy signal is flashing time to time, that is one way that the tool can help you to filter noise from markets and check only that charts where something is happening
매매 수동청산
Update on  KMD, All targets met. I will close my position here. Hope you got the 30%+ profit too!. #KMD Happy trading!

면책사항
해당 정보와 게시물은 금융, 투자, 트레이딩 또는 기타 유형의 조언이나 권장 사항으로 간주되지 않으며, 트레이딩뷰에서 제공하거나 보증하는 것이 아닙니다. 자세한 내용은 이용 약관을 참조하세요.
면책사항
해당 정보와 게시물은 금융, 투자, 트레이딩 또는 기타 유형의 조언이나 권장 사항으로 간주되지 않으며, 트레이딩뷰에서 제공하거나 보증하는 것이 아닙니다. 자세한 내용은 이용 약관을 참조하세요.