
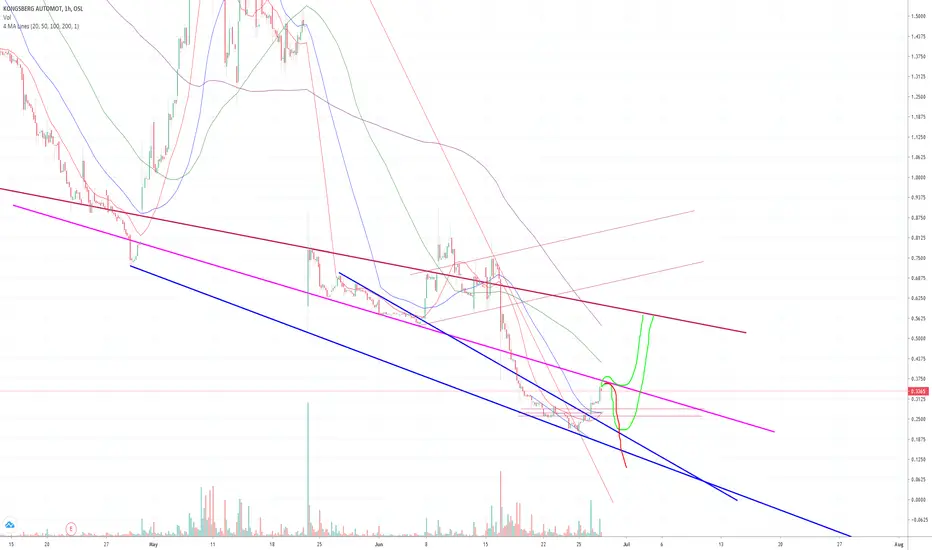
Let's see if it can break the purple line and find support on it, 60% gains possible then (Fat red resistance line). If it breaks the fat red line, who knows how high we can go.
If it bounces of the purple and find support on the blue one's 160-280 % gains. Just see where it finds support before buying.
I bought already on 0.28 NOK (bullish rsi on daily chart) watched it go down but decided to keep it.
I wouldn't throw too much money at it, but i also don't think it will go bankrupt.
If it bounces of the purple and find support on the blue one's 160-280 % gains. Just see where it finds support before buying.
I bought already on 0.28 NOK (bullish rsi on daily chart) watched it go down but decided to keep it.
I wouldn't throw too much money at it, but i also don't think it will go bankrupt.
거래청산: 스탑 닿음

면책사항
해당 정보와 게시물은 금융, 투자, 트레이딩 또는 기타 유형의 조언이나 권장 사항으로 간주되지 않으며, 트레이딩뷰에서 제공하거나 보증하는 것이 아닙니다. 자세한 내용은 이용 약관을 참조하세요.
면책사항
해당 정보와 게시물은 금융, 투자, 트레이딩 또는 기타 유형의 조언이나 권장 사항으로 간주되지 않으며, 트레이딩뷰에서 제공하거나 보증하는 것이 아닙니다. 자세한 내용은 이용 약관을 참조하세요.