
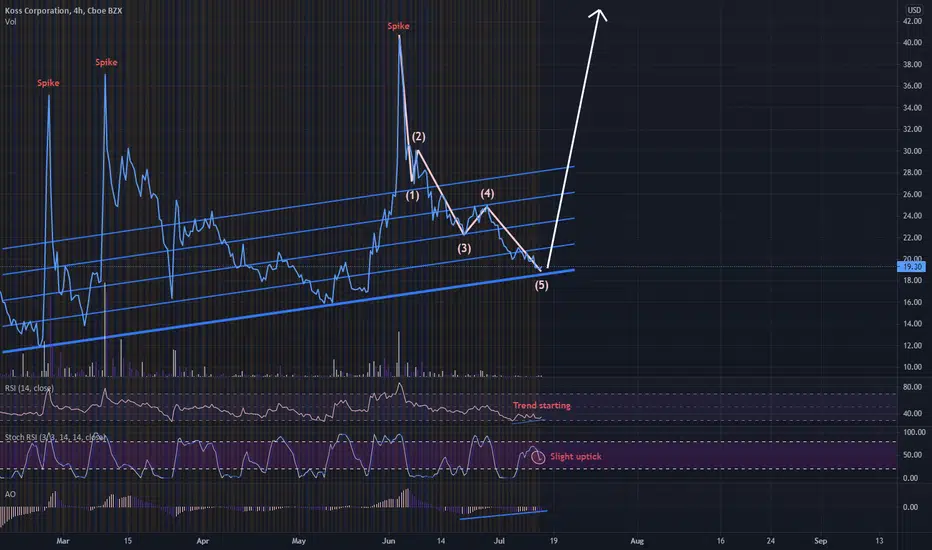
KOSS has exhibited high price spikes on the last 4 up moves and it may repeat that behavior. The 4-hour chart helps illustrate the short-term duration of the recent price moves.
Indicators, lower trendline, and wave structure supporting a potential reversal soon.
Further KOSS has made a higher high the last three up moves, so the expectation is that trend continues. Obviously the question is how high. Not sure as the sell-offs have been swift.
The weekly chart appears to support more up - potentially significant more up, with a large bull flag formation evident on the log setting. However KOSS has thus far rewarded very nimble traders.
The SI% and borrow rates for KOSS remain high, but this condition has been in play for a while now and thus far hasn't resulted in significant short covering IMO. Perhaps soon.
Not financial advice.
Indicators, lower trendline, and wave structure supporting a potential reversal soon.
Further KOSS has made a higher high the last three up moves, so the expectation is that trend continues. Obviously the question is how high. Not sure as the sell-offs have been swift.
The weekly chart appears to support more up - potentially significant more up, with a large bull flag formation evident on the log setting. However KOSS has thus far rewarded very nimble traders.
The SI% and borrow rates for KOSS remain high, but this condition has been in play for a while now and thus far hasn't resulted in significant short covering IMO. Perhaps soon.
Not financial advice.

면책사항
해당 정보와 게시물은 금융, 투자, 트레이딩 또는 기타 유형의 조언이나 권장 사항으로 간주되지 않으며, 트레이딩뷰에서 제공하거나 보증하는 것이 아닙니다. 자세한 내용은 이용 약관을 참조하세요.
면책사항
해당 정보와 게시물은 금융, 투자, 트레이딩 또는 기타 유형의 조언이나 권장 사항으로 간주되지 않으며, 트레이딩뷰에서 제공하거나 보증하는 것이 아닙니다. 자세한 내용은 이용 약관을 참조하세요.