
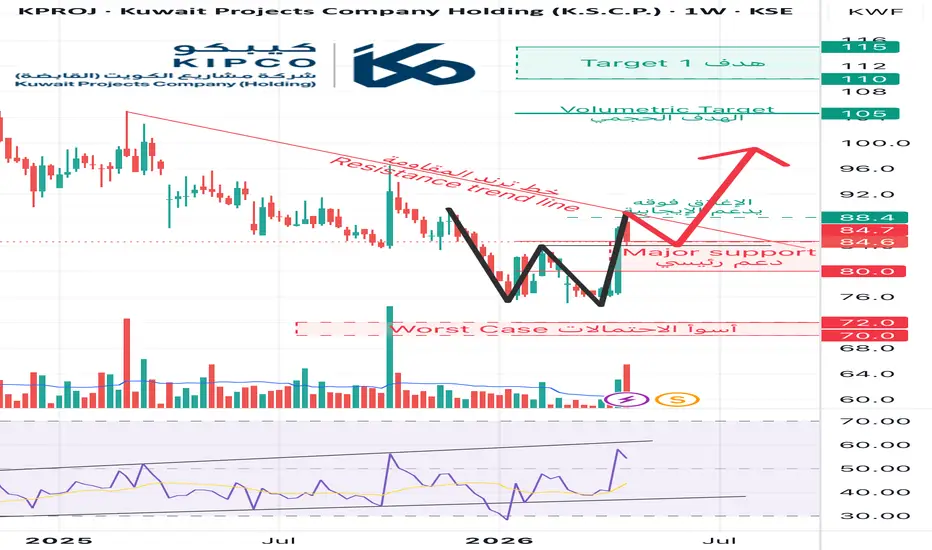
The weekly chart for KPROJ highlights a critical juncture for the stock. Price is consolidating near the 84–85 support zone, which has acted as a major pivot in recent sessions. The Relative Strength Index (RSI) has climbed above the 50 line, signaling a potential shift in momentum toward the bulls.
- A potential double-bottom (W pattern) is forming, with confirmation only if price closes above the 90–92 neckline.
- Major support sits at 82–84. Holding this level strengthens the bullish case, while a break below could expose the stock to 76–72 as a worst-case scenario.
- Resistance trend line remains overhead. A decisive breakout above 90–92 would invalidate the bearish structure and open the path to higher targets.
- Volume analysis shows declining sell pressure, suggesting the recent pullback may be corrective rather than a trend reversal.
Targets Ahead:
• First target: 95–101 (key resistance zone).
• Volumetric target: 105.
• Extended target: 115, achievable if momentum sustains after breaking the neckline.
Conclusion:
KPROJ is at a pivotal support level. The bias leans bullish as long as price holds above 82–84 and RSI remains above 50. Traders should watch closely for a weekly close above 90–92, which would confirm a breakout and set the stage for a move toward 105–115. Conversely, failure to hold support could trigger a deeper correction toward 72.

면책사항
해당 정보와 게시물은 금융, 투자, 트레이딩 또는 기타 유형의 조언이나 권장 사항으로 간주되지 않으며, 트레이딩뷰에서 제공하거나 보증하는 것이 아닙니다. 자세한 내용은 이용 약관을 참조하세요.
면책사항
해당 정보와 게시물은 금융, 투자, 트레이딩 또는 기타 유형의 조언이나 권장 사항으로 간주되지 않으며, 트레이딩뷰에서 제공하거나 보증하는 것이 아닙니다. 자세한 내용은 이용 약관을 참조하세요.