
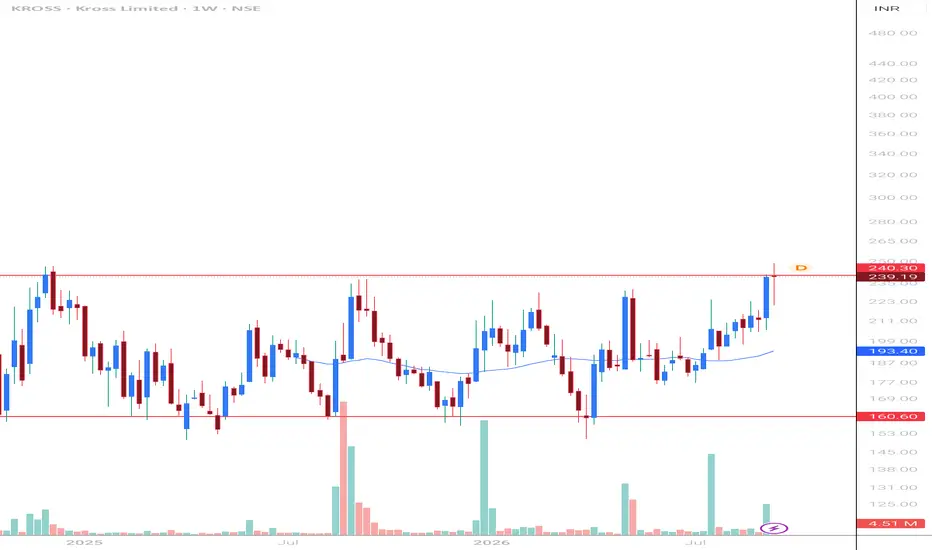
Kross Ltd is testing a major resistance level near ₹240 on the weekly timeframe. The stock has been building a wide base between ₹150–₹240, with strong green volume candles indicating accumulation during upward swings.
Technical Breakdown:
Timeframe: Weekly (1W)
Resistance Level: ₹240
Support Zone: ₹150 – ₹175
Volume Profile: Rising buyer volume on bullish weeks
Fundamental Snapshot:
Market Cap: ₹1,564 Cr (Small Cap)
P/E (TTM): 27.05 vs. Industry P/E: 45.46 (Trading at a discount relative to peers)
Debt to Equity: 0.11 (Virtually debt-free balance sheet)
1Y TTM Profit Growth: +24%
Trading Strategy / Setup:
Breakout Watch: Looking for a decisive weekly candle close above ₹240 to confirm the breakout.
Alternative Entry: Re-entry/continuation on a successful retest of the ₹240 level post-breakout.
(For educational purposes only. Not financial advice. Please perform your own due diligence before taking any position.)
Technical Breakdown:
Timeframe: Weekly (1W)
Resistance Level: ₹240
Support Zone: ₹150 – ₹175
Volume Profile: Rising buyer volume on bullish weeks
Fundamental Snapshot:
Market Cap: ₹1,564 Cr (Small Cap)
P/E (TTM): 27.05 vs. Industry P/E: 45.46 (Trading at a discount relative to peers)
Debt to Equity: 0.11 (Virtually debt-free balance sheet)
1Y TTM Profit Growth: +24%
Trading Strategy / Setup:
Breakout Watch: Looking for a decisive weekly candle close above ₹240 to confirm the breakout.
Alternative Entry: Re-entry/continuation on a successful retest of the ₹240 level post-breakout.
(For educational purposes only. Not financial advice. Please perform your own due diligence before taking any position.)

면책사항
해당 정보와 게시물은 금융, 투자, 트레이딩 또는 기타 유형의 조언이나 권장 사항으로 간주되지 않으며, 트레이딩뷰에서 제공하거나 보증하는 것이 아닙니다. 자세한 내용은 이용 약관을 참조하세요.
면책사항
해당 정보와 게시물은 금융, 투자, 트레이딩 또는 기타 유형의 조언이나 권장 사항으로 간주되지 않으며, 트레이딩뷰에서 제공하거나 보증하는 것이 아닙니다. 자세한 내용은 이용 약관을 참조하세요.