Long
KSM: Hidden Bullish Divergence Daily TF
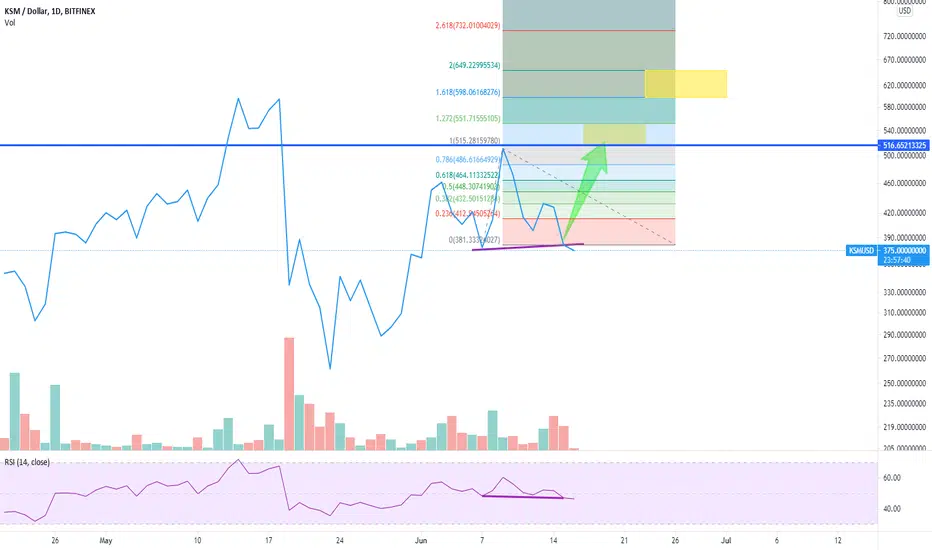
KSM's price is printing a high low on Daily TF while the RSI is showing a lower low. We can now expect a new peak to be formed (yellow box)
The most ideal place where a hidden bullish divergence can occur is at the end of a downtrend which is exactly what has happened since the June 9th downtrend!
As long as BTC holds steady expect this to play out to the upside
The most ideal place where a hidden bullish divergence can occur is at the end of a downtrend which is exactly what has happened since the June 9th downtrend!
As long as BTC holds steady expect this to play out to the upside

관련 발행물
면책사항
해당 정보와 게시물은 금융, 투자, 트레이딩 또는 기타 유형의 조언이나 권장 사항으로 간주되지 않으며, 트레이딩뷰에서 제공하거나 보증하는 것이 아닙니다. 자세한 내용은 이용 약관을 참조하세요.
면책사항
해당 정보와 게시물은 금융, 투자, 트레이딩 또는 기타 유형의 조언이나 권장 사항으로 간주되지 않으며, 트레이딩뷰에서 제공하거나 보증하는 것이 아닙니다. 자세한 내용은 이용 약관을 참조하세요.