
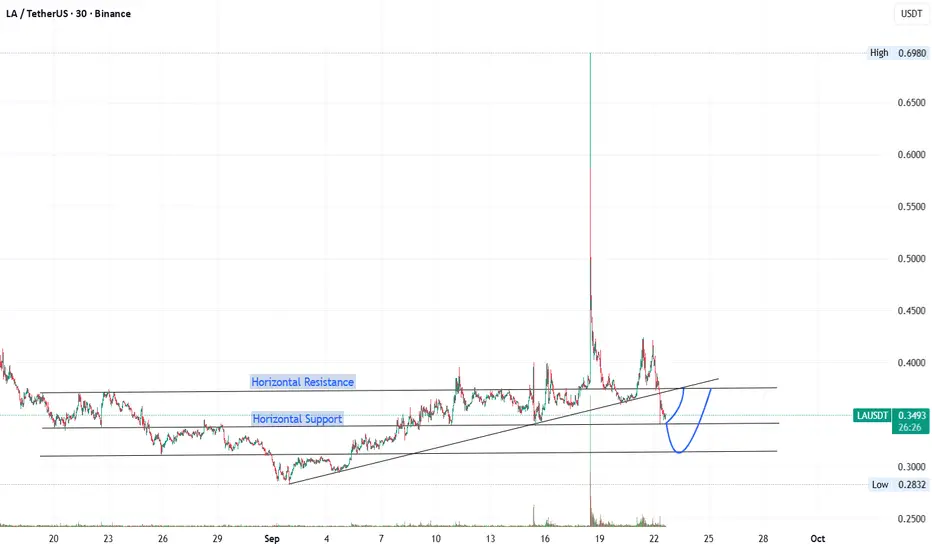
Support levels: You’ve correctly marked two horizontal supports. The lower one around 0.283 (recent low) and the higher one around 0.34–0.35 zone.
Trendline: There’s a clear ascending trendline, which price briefly broke below before bouncing back.
Volume spike: That huge wick up to 0.6980 looks like a liquidity grab or abnormal spike, not a sustained move.
Current structure: Price is testing the horizontal support at ~0.34 after breaking trendline support. Your curved arrow suggests a rebound from support back toward resistance.
Trendline: There’s a clear ascending trendline, which price briefly broke below before bouncing back.
Volume spike: That huge wick up to 0.6980 looks like a liquidity grab or abnormal spike, not a sustained move.
Current structure: Price is testing the horizontal support at ~0.34 after breaking trendline support. Your curved arrow suggests a rebound from support back toward resistance.
- Bullish scenario: Hold above 0.34 → retest 0.38–0.40 area.
- Bearish scenario: Lose 0.34 → likely retest 0.28.

면책사항
해당 정보와 게시물은 금융, 투자, 트레이딩 또는 기타 유형의 조언이나 권장 사항으로 간주되지 않으며, 트레이딩뷰에서 제공하거나 보증하는 것이 아닙니다. 자세한 내용은 이용 약관을 참조하세요.
면책사항
해당 정보와 게시물은 금융, 투자, 트레이딩 또는 기타 유형의 조언이나 권장 사항으로 간주되지 않으며, 트레이딩뷰에서 제공하거나 보증하는 것이 아닙니다. 자세한 내용은 이용 약관을 참조하세요.