
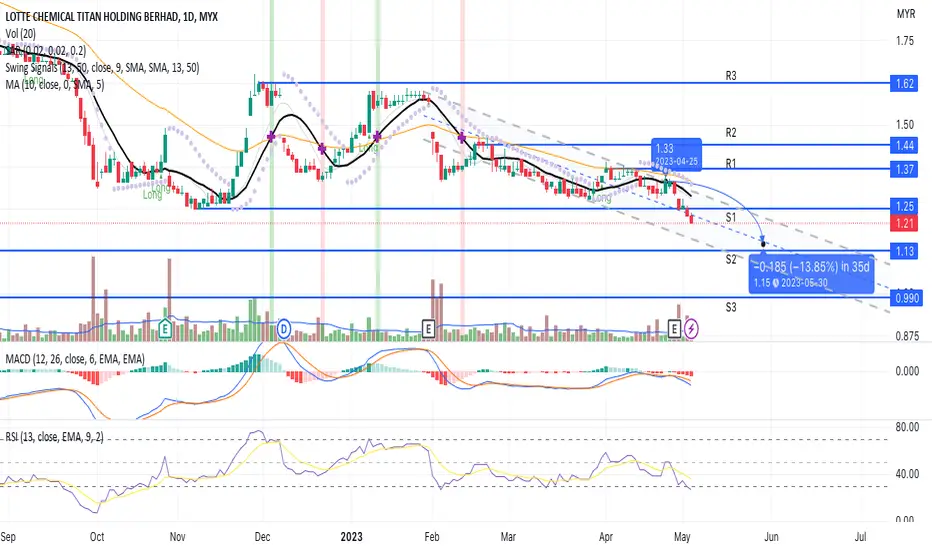
The candlestick signs a weak demand. Hence, a downtrend pattern emerged where the price closed below the S1 line due to a price being pushed down by a strong Bearish pressure. A strong counterattack of Bullish pressure is required to break the decline. As a result, when "Smart Money" is in need to break a strong decline, they have to put a lot of buying pressure and strong volume surge.
MACD and RSI confirm the price downtrend pattern.
The S2 line will be the next low price if the price steadily declines due to weak demand from the buyer.
Let's save LCTITAN in WL for the possibility of a reversal up signal could be expected.
S1 1.25, S2 1.10, S3 1.00
MACD and RSI confirm the price downtrend pattern.
The S2 line will be the next low price if the price steadily declines due to weak demand from the buyer.
Let's save LCTITAN in WL for the possibility of a reversal up signal could be expected.
S1 1.25, S2 1.10, S3 1.00

면책사항
해당 정보와 게시물은 금융, 투자, 트레이딩 또는 기타 유형의 조언이나 권장 사항으로 간주되지 않으며, 트레이딩뷰에서 제공하거나 보증하는 것이 아닙니다. 자세한 내용은 이용 약관을 참조하세요.
면책사항
해당 정보와 게시물은 금융, 투자, 트레이딩 또는 기타 유형의 조언이나 권장 사항으로 간주되지 않으며, 트레이딩뷰에서 제공하거나 보증하는 것이 아닙니다. 자세한 내용은 이용 약관을 참조하세요.