
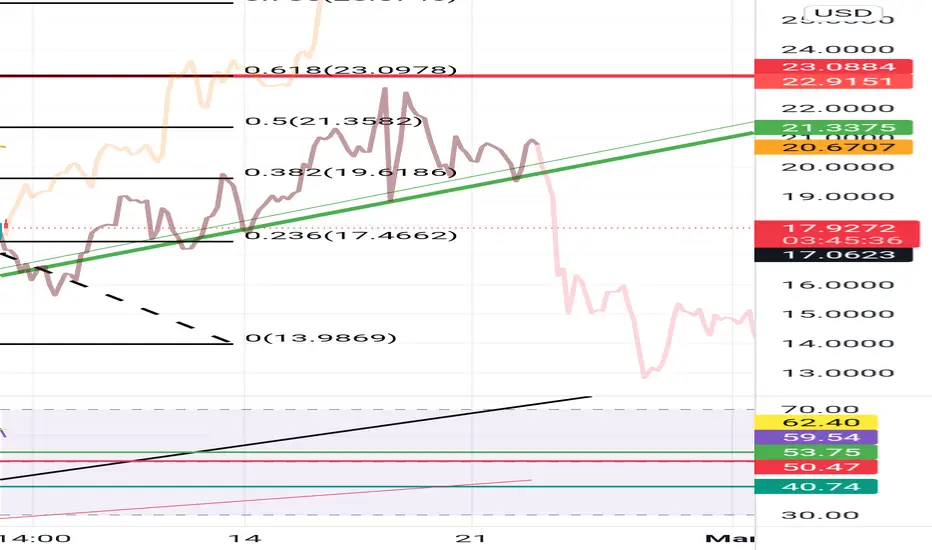
This will chart chainlinks performance on a 4 hour chart
The orange line represents the highs 200 days ago today and the black line represents the highs 100 days ago today.
I placed them along the current highs as of 1500 hours today. This is just done out of morbid curiosity.
The orange line represents the highs 200 days ago today and the black line represents the highs 100 days ago today.
I placed them along the current highs as of 1500 hours today. This is just done out of morbid curiosity.

면책사항
해당 정보와 게시물은 금융, 투자, 트레이딩 또는 기타 유형의 조언이나 권장 사항으로 간주되지 않으며, 트레이딩뷰에서 제공하거나 보증하는 것이 아닙니다. 자세한 내용은 이용 약관을 참조하세요.
면책사항
해당 정보와 게시물은 금융, 투자, 트레이딩 또는 기타 유형의 조언이나 권장 사항으로 간주되지 않으며, 트레이딩뷰에서 제공하거나 보증하는 것이 아닙니다. 자세한 내용은 이용 약관을 참조하세요.