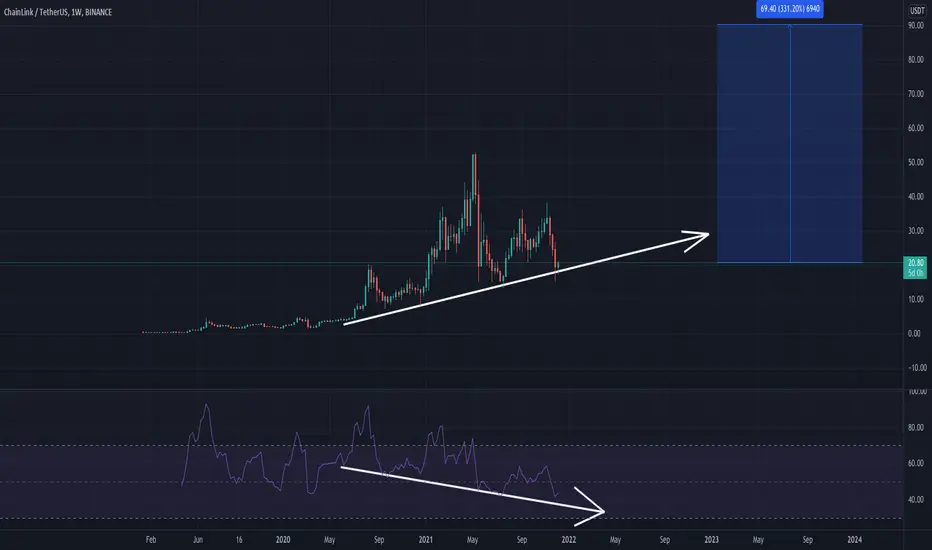

 LINKUSDT is a monster in disguise, with a huge surprise waiting around the corner.
 On the weekly timeframe chart, we can see a monster-sized hidden bullish divergence. The price action has been printing higher lows, while the RSI has been printing lower lows. By definition, this is a hidden bullish divergence. Something like this appearing on a high time frame, in our example the 1-Week time frame, can only mean one thing: a huge move on the upside is waiting for us.
Fundamentally,
LINKUSDT is also a fantastic project, having just partnered up with the former GOOGLE CEO - Eric Schmidt. I have never been so excited for a project before! Good luck,
Your Ganbu
⚠️ Let me know your feedback and comments below!
⚠️ Follow me if you would like to see more analysis like this

면책사항
해당 정보와 게시물은 금융, 투자, 트레이딩 또는 기타 유형의 조언이나 권장 사항으로 간주되지 않으며, 트레이딩뷰에서 제공하거나 보증하는 것이 아닙니다. 자세한 내용은 이용 약관을 참조하세요.
면책사항
해당 정보와 게시물은 금융, 투자, 트레이딩 또는 기타 유형의 조언이나 권장 사항으로 간주되지 않으며, 트레이딩뷰에서 제공하거나 보증하는 것이 아닙니다. 자세한 내용은 이용 약관을 참조하세요.