
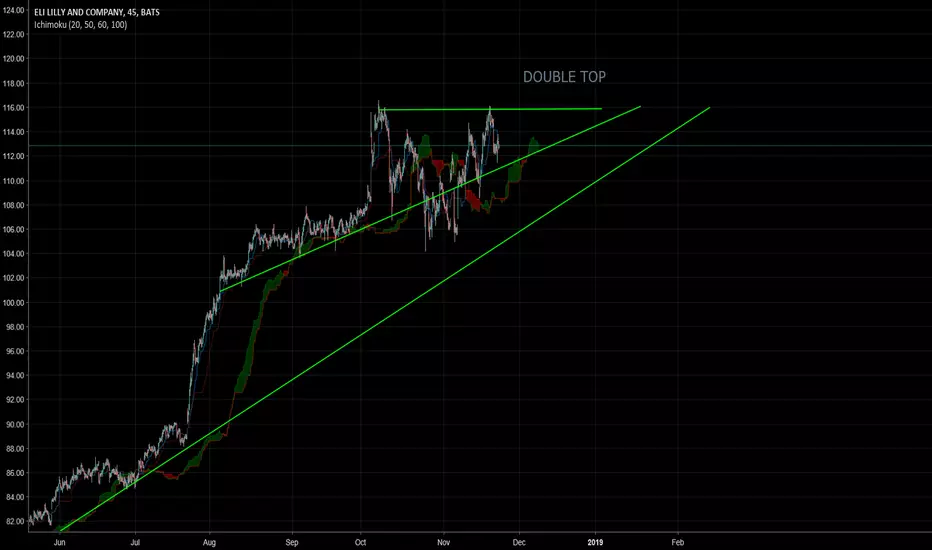
Despite stocks market downfall LLY is thriving for bullish pattern. However based on TA this waves is going to turn out soon.
Reasoning for this includes double top on all time high price; Second reason provided by MACD and sch RSI both shown a short opportunity for 35 M timeframe.
To be on safe side if the wave was constructed for correction towards bullish. the middle green line will be a indicator for diagonal support turning point ( around 110) due to previous year short trend was near nil possibility.
Reasoning for this includes double top on all time high price; Second reason provided by MACD and sch RSI both shown a short opportunity for 35 M timeframe.
To be on safe side if the wave was constructed for correction towards bullish. the middle green line will be a indicator for diagonal support turning point ( around 110) due to previous year short trend was near nil possibility.

면책사항
해당 정보와 게시물은 금융, 투자, 트레이딩 또는 기타 유형의 조언이나 권장 사항으로 간주되지 않으며, 트레이딩뷰에서 제공하거나 보증하는 것이 아닙니다. 자세한 내용은 이용 약관을 참조하세요.
면책사항
해당 정보와 게시물은 금융, 투자, 트레이딩 또는 기타 유형의 조언이나 권장 사항으로 간주되지 않으며, 트레이딩뷰에서 제공하거나 보증하는 것이 아닙니다. 자세한 내용은 이용 약관을 참조하세요.