
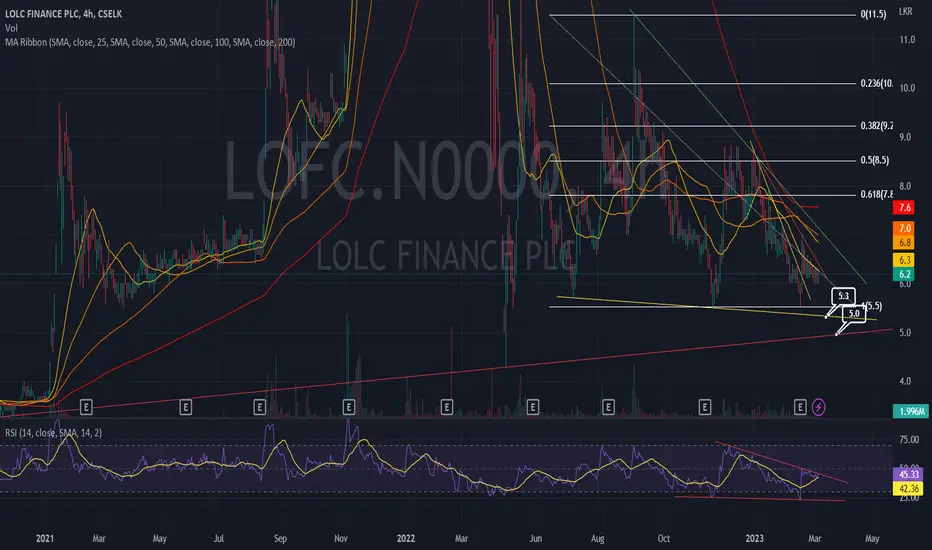
While moving below all SMA, LOFC seems having good volumes coming in at current levels.
trendline supports can be seen in 5.3 and 5.0 respectively. However given the nature of the counter, below 5.0 should be the
immediate stoploss for traders who takes positions at above levels.
RSI shows about to breakout its trendline
PS - go through the chart thoroughly, i have added much information in it.
trendline supports can be seen in 5.3 and 5.0 respectively. However given the nature of the counter, below 5.0 should be the
immediate stoploss for traders who takes positions at above levels.
RSI shows about to breakout its trendline
PS - go through the chart thoroughly, i have added much information in it.

면책사항
해당 정보와 게시물은 금융, 투자, 트레이딩 또는 기타 유형의 조언이나 권장 사항으로 간주되지 않으며, 트레이딩뷰에서 제공하거나 보증하는 것이 아닙니다. 자세한 내용은 이용 약관을 참조하세요.
면책사항
해당 정보와 게시물은 금융, 투자, 트레이딩 또는 기타 유형의 조언이나 권장 사항으로 간주되지 않으며, 트레이딩뷰에서 제공하거나 보증하는 것이 아닙니다. 자세한 내용은 이용 약관을 참조하세요.