
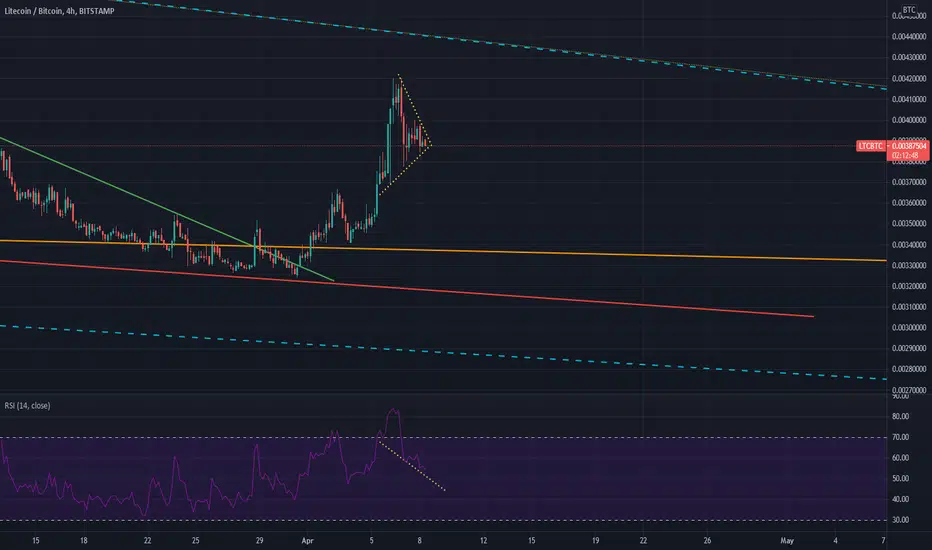
LTCBTC looks to be forming a potentially bullish pennant on the 4-hour chart (yellow dotted lines). This looks to be somewhat confirmed by the hidden bullish divergence on RSI (dotted yellow lines on RSI and price), looking more likely to indicate a continuation upward based on the short-term trend.
There is still some potential for the trend to extend further forward for hours/days, but it is good news for LTCBTC that it has not trended downward yet (particularly when BTCUSD took a dip over a day ago).
If the pennant breaks upwards, the resistance looks to be at the upper part of the wedge I mentioned before (blue dashed lines). If this resistance breaks, LTCBTC has the potential to break from the year long descending wedge and the opportunity to take on a YEARS long wedge instead (see my previous posts for details).
At the very least it should be interesting to see which way the current wedge breaks over the next few hours/days.
There is still some potential for the trend to extend further forward for hours/days, but it is good news for LTCBTC that it has not trended downward yet (particularly when BTCUSD took a dip over a day ago).
If the pennant breaks upwards, the resistance looks to be at the upper part of the wedge I mentioned before (blue dashed lines). If this resistance breaks, LTCBTC has the potential to break from the year long descending wedge and the opportunity to take on a YEARS long wedge instead (see my previous posts for details).
At the very least it should be interesting to see which way the current wedge breaks over the next few hours/days.

면책사항
해당 정보와 게시물은 금융, 투자, 트레이딩 또는 기타 유형의 조언이나 권장 사항으로 간주되지 않으며, 트레이딩뷰에서 제공하거나 보증하는 것이 아닙니다. 자세한 내용은 이용 약관을 참조하세요.
면책사항
해당 정보와 게시물은 금융, 투자, 트레이딩 또는 기타 유형의 조언이나 권장 사항으로 간주되지 않으며, 트레이딩뷰에서 제공하거나 보증하는 것이 아닙니다. 자세한 내용은 이용 약관을 참조하세요.