A week ago, we examined the LTC chart and the downward falling wedge pattern we observed (medium.com/@BitOoda/ltc-chart-and-btc-call-writing-afdb16f55d73). As of last night, LTC has broken through that $75 level and is trading a few dollars south of $75 this morning. All we see is ‘air’ down to $60, meaning that if a selloff precipitates throughout the crypto space, we do not see much support until the $60 level.
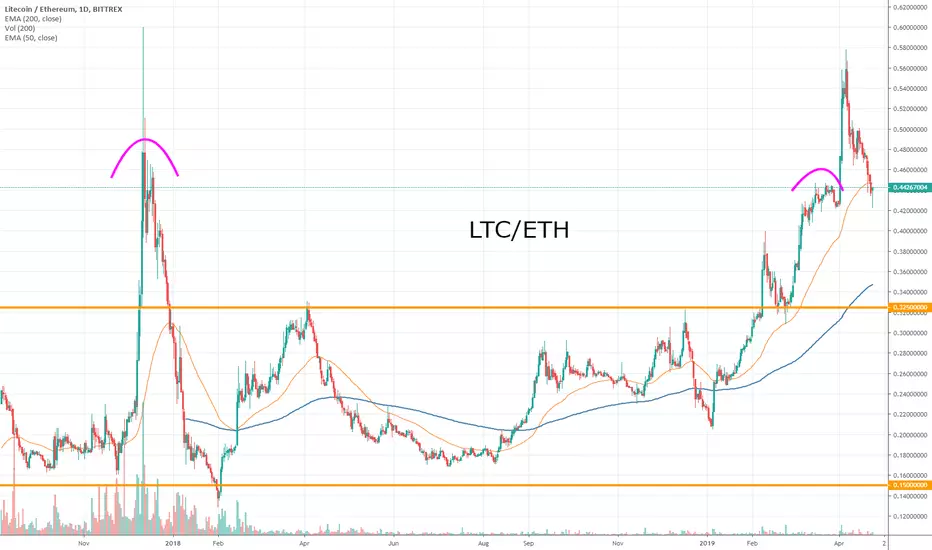
Another chart that had caught our eye we wrote about on March 26th, the LTC/ETH Trading Pair (medium.com/@BitOoda/ltc-eth-trading-pair-3675705b626c). We happened to put this “Mean Reversion” trading piece out right before the April 1st crypto rally, which caused the trading pair to appear as though it was making a massive break-out. As prices have settled down and consolidated over the last month, we see this trading pair has made a retracement right back to the ~0.438 level of late March. We believe this confirms our thesis, along with the price action seen in December, that the trading pair will not be sustainable north of 0.500.
Another chart that had caught our eye we wrote about on March 26th, the LTC/ETH Trading Pair (medium.com/@BitOoda/ltc-eth-trading-pair-3675705b626c). We happened to put this “Mean Reversion” trading piece out right before the April 1st crypto rally, which caused the trading pair to appear as though it was making a massive break-out. As prices have settled down and consolidated over the last month, we see this trading pair has made a retracement right back to the ~0.438 level of late March. We believe this confirms our thesis, along with the price action seen in December, that the trading pair will not be sustainable north of 0.500.

면책사항
해당 정보와 게시물은 금융, 투자, 트레이딩 또는 기타 유형의 조언이나 권장 사항으로 간주되지 않으며, 트레이딩뷰에서 제공하거나 보증하는 것이 아닙니다. 자세한 내용은 이용 약관을 참조하세요.
면책사항
해당 정보와 게시물은 금융, 투자, 트레이딩 또는 기타 유형의 조언이나 권장 사항으로 간주되지 않으며, 트레이딩뷰에서 제공하거나 보증하는 것이 아닙니다. 자세한 내용은 이용 약관을 참조하세요.