
Hello all and good evening!
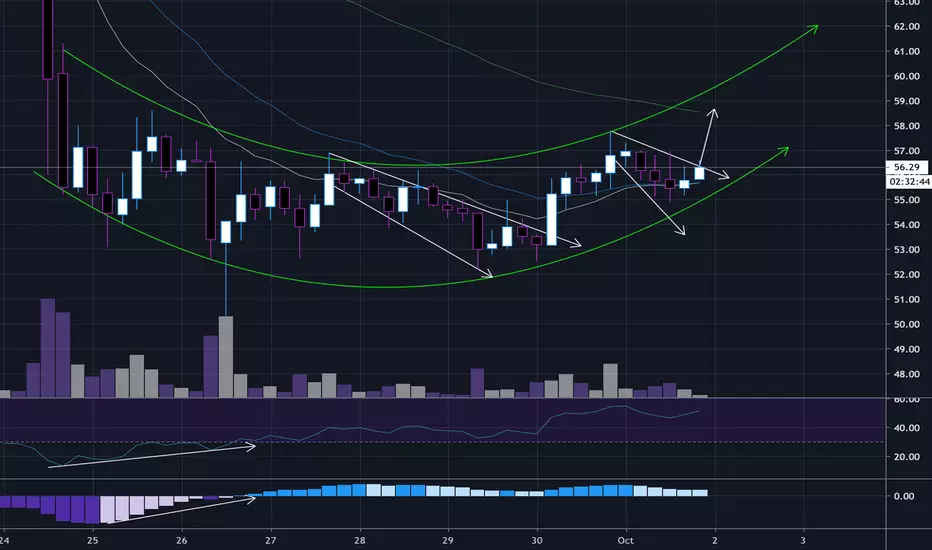
LTC hit $50 as a low recently and has been rounding out in the lower 50 range since. There was a bullish divergence signal on the 4H for both the RSI and MACD. Currently RSI is attempting upper territory with MACD reseting positive momentum. We should always be on the lookout for bearish signals as well. If we see price attempt higher highs with less positive momentum, this would be an indication of a rejection. This would present itself as the MACD showing a lower positive value on the histogram relative to the prior with the RSI underneath the previous high point as well.

15 minute chart, price is printing a descending broadening structure to the curved support line. Breakout target would be above the top of the wedge.

1H chart we can get a sense of the down sloping consolidations leading to the curved support line, then breaking up towards the upper curved line.

4H chart zoomed out.

1D chart RSI bullish divergence with MACD reseting. Possibly making its way back up to the 13 EMA at $59.79
Let me know what you think! Has LTC hit a bottom?
LTC hit $50 as a low recently and has been rounding out in the lower 50 range since. There was a bullish divergence signal on the 4H for both the RSI and MACD. Currently RSI is attempting upper territory with MACD reseting positive momentum. We should always be on the lookout for bearish signals as well. If we see price attempt higher highs with less positive momentum, this would be an indication of a rejection. This would present itself as the MACD showing a lower positive value on the histogram relative to the prior with the RSI underneath the previous high point as well.
15 minute chart, price is printing a descending broadening structure to the curved support line. Breakout target would be above the top of the wedge.
1H chart we can get a sense of the down sloping consolidations leading to the curved support line, then breaking up towards the upper curved line.
4H chart zoomed out.
1D chart RSI bullish divergence with MACD reseting. Possibly making its way back up to the 13 EMA at $59.79
Let me know what you think! Has LTC hit a bottom?
노트
recent development with a different outlook. Rising support with a horizontal resistance. Breakout target would be just under the 200 EMA on the 4H.
노트
Price breaking out of a symmetrical triangle at the apex of the larger rising one.

면책사항
해당 정보와 게시물은 금융, 투자, 트레이딩 또는 기타 유형의 조언이나 권장 사항으로 간주되지 않으며, 트레이딩뷰에서 제공하거나 보증하는 것이 아닙니다. 자세한 내용은 이용 약관을 참조하세요.
면책사항
해당 정보와 게시물은 금융, 투자, 트레이딩 또는 기타 유형의 조언이나 권장 사항으로 간주되지 않으며, 트레이딩뷰에서 제공하거나 보증하는 것이 아닙니다. 자세한 내용은 이용 약관을 참조하세요.