
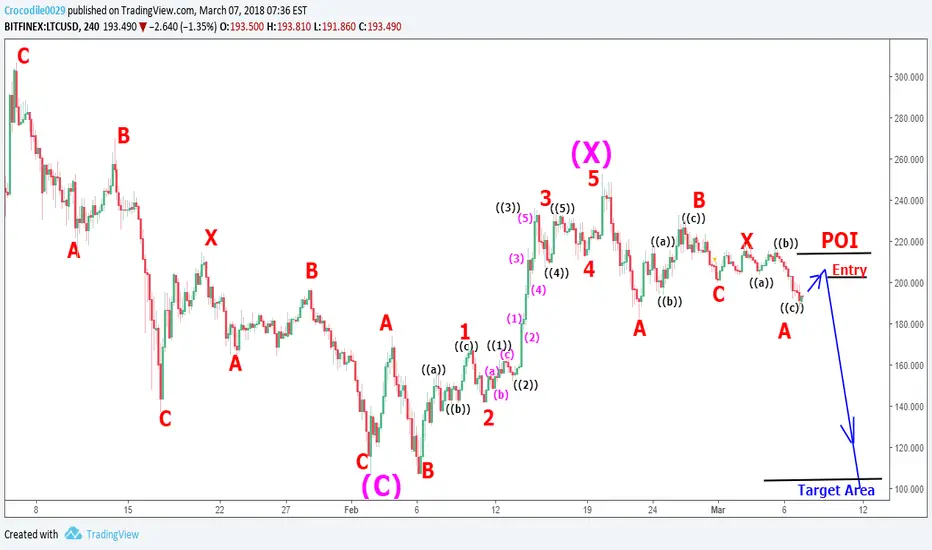
I have updated and used the Elliott wave principle in this post to model the price action of LTCUSD. Chart patterns for LTCUSD annotated and the comments I gave can be found in this post: 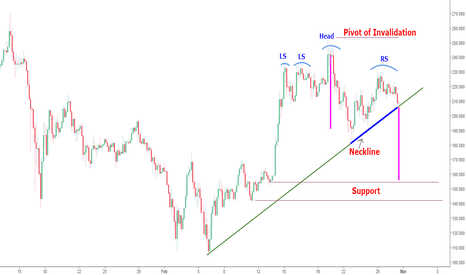
Currently, LTCUSD is shaping up as a double zigzag Elliott wave structure (A-B-C-X-A-B-C). The implication of this is that the minimum target for LTCUSD is the price low of ~$106.52 made on Feb. 6,2018.
I have also indicated a possible entry point on the chart as I expect a quick bounce to the $201 area after which price should continue downwards.
POI = (Point of invalidation) i.e. I do not want to see price of LTCUSD close above ~$214. Price close above $214 would warrant a review of this analysis.
Using the ideal scenario above gives a risk of ~ $13 (i.e. $214 - $201)
Using the low of Feb. 6, 2018 as target for profit, reward= $201 - 106 = $95
Risk/reward ratio= $95/$13 = ~7.3:1
Currently, LTCUSD is shaping up as a double zigzag Elliott wave structure (A-B-C-X-A-B-C). The implication of this is that the minimum target for LTCUSD is the price low of ~$106.52 made on Feb. 6,2018.
I have also indicated a possible entry point on the chart as I expect a quick bounce to the $201 area after which price should continue downwards.
POI = (Point of invalidation) i.e. I do not want to see price of LTCUSD close above ~$214. Price close above $214 would warrant a review of this analysis.
Using the ideal scenario above gives a risk of ~ $13 (i.e. $214 - $201)
Using the low of Feb. 6, 2018 as target for profit, reward= $201 - 106 = $95
Risk/reward ratio= $95/$13 = ~7.3:1

면책사항
해당 정보와 게시물은 금융, 투자, 트레이딩 또는 기타 유형의 조언이나 권장 사항으로 간주되지 않으며, 트레이딩뷰에서 제공하거나 보증하는 것이 아닙니다. 자세한 내용은 이용 약관을 참조하세요.
면책사항
해당 정보와 게시물은 금융, 투자, 트레이딩 또는 기타 유형의 조언이나 권장 사항으로 간주되지 않으며, 트레이딩뷰에서 제공하거나 보증하는 것이 아닙니다. 자세한 내용은 이용 약관을 참조하세요.