
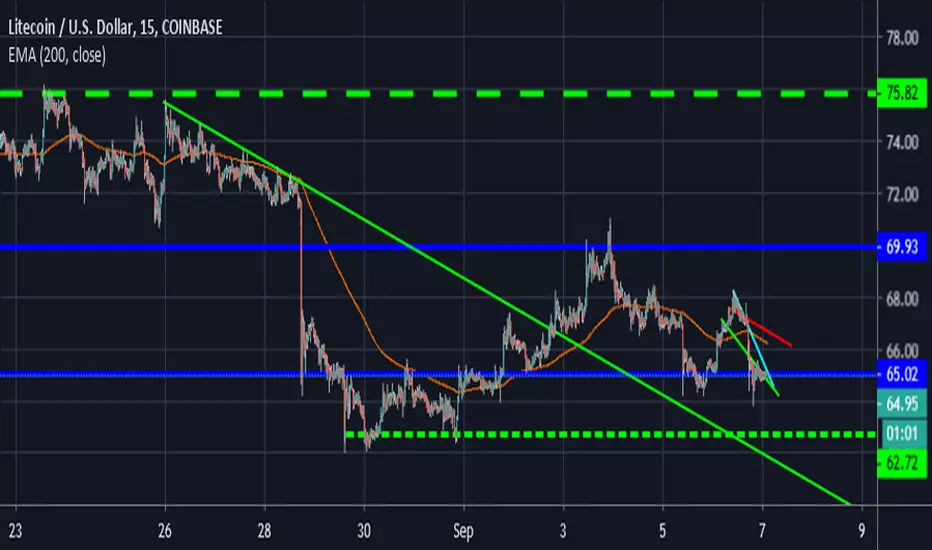
Just my interpretation of the Litecoin consolidation. Short Term Long here at the bottom of the BLUE CHANNEL. Half profits may be taken at the top blue line (channel top). If price continues to hold above the blue channel, the next PROFIT TARGET will be the green DASHED line.
The DIAGONAL green line notates a trend break. Price has broken the downtrend & held above it. This could be a reversal signal, as price tries to retest the Highs.
Seeing channel analysis done in different ways helps with identifying price structure, anticipating entries, & predicting profit targets.

면책사항
해당 정보와 게시물은 금융, 투자, 트레이딩 또는 기타 유형의 조언이나 권장 사항으로 간주되지 않으며, 트레이딩뷰에서 제공하거나 보증하는 것이 아닙니다. 자세한 내용은 이용 약관을 참조하세요.
면책사항
해당 정보와 게시물은 금융, 투자, 트레이딩 또는 기타 유형의 조언이나 권장 사항으로 간주되지 않으며, 트레이딩뷰에서 제공하거나 보증하는 것이 아닙니다. 자세한 내용은 이용 약관을 참조하세요.