
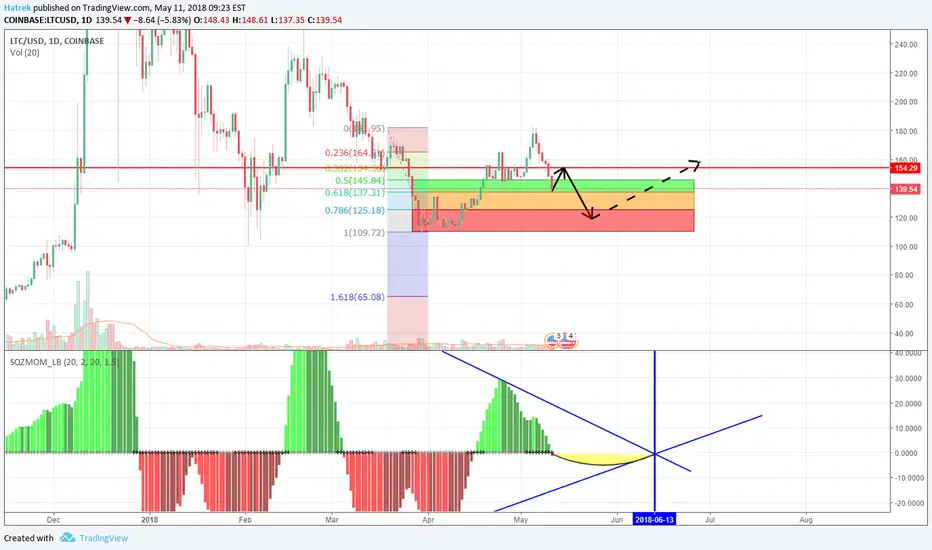
While bears is taking over the market, just analyze the chart to take corrections opportunities during the bearish momentum.
Now we are at the 50% Fib and we may expect a bottom pattern if we want to trade a possible upward move. Check the hour-chart or 4hour-chart to see if entering for a short trade is interesting. Moreover, to be sure, take a look at the BTCUSD chart.
On the long-term, either LTCUSD stops the bearish momentum between 50%-61.8% Fib and we would see the wave 2 of Elliot impulse wave formed, or we would return to higher lows than the one in March-April.
Whatever, with the Squeeze Momentum indicator, you could see that bearish momentum won't be higher than the two previous bearish moves.
I draw three zones that match the Fib retracement levels. That zones are important and are often in which consolidations happen.
Some updates coming if there are some changes.
Now we are at the 50% Fib and we may expect a bottom pattern if we want to trade a possible upward move. Check the hour-chart or 4hour-chart to see if entering for a short trade is interesting. Moreover, to be sure, take a look at the BTCUSD chart.
On the long-term, either LTCUSD stops the bearish momentum between 50%-61.8% Fib and we would see the wave 2 of Elliot impulse wave formed, or we would return to higher lows than the one in March-April.
Whatever, with the Squeeze Momentum indicator, you could see that bearish momentum won't be higher than the two previous bearish moves.
I draw three zones that match the Fib retracement levels. That zones are important and are often in which consolidations happen.
Some updates coming if there are some changes.

관련 발행물
면책사항
해당 정보와 게시물은 금융, 투자, 트레이딩 또는 기타 유형의 조언이나 권장 사항으로 간주되지 않으며, 트레이딩뷰에서 제공하거나 보증하는 것이 아닙니다. 자세한 내용은 이용 약관을 참조하세요.
면책사항
해당 정보와 게시물은 금융, 투자, 트레이딩 또는 기타 유형의 조언이나 권장 사항으로 간주되지 않으며, 트레이딩뷰에서 제공하거나 보증하는 것이 아닙니다. 자세한 내용은 이용 약관을 참조하세요.