
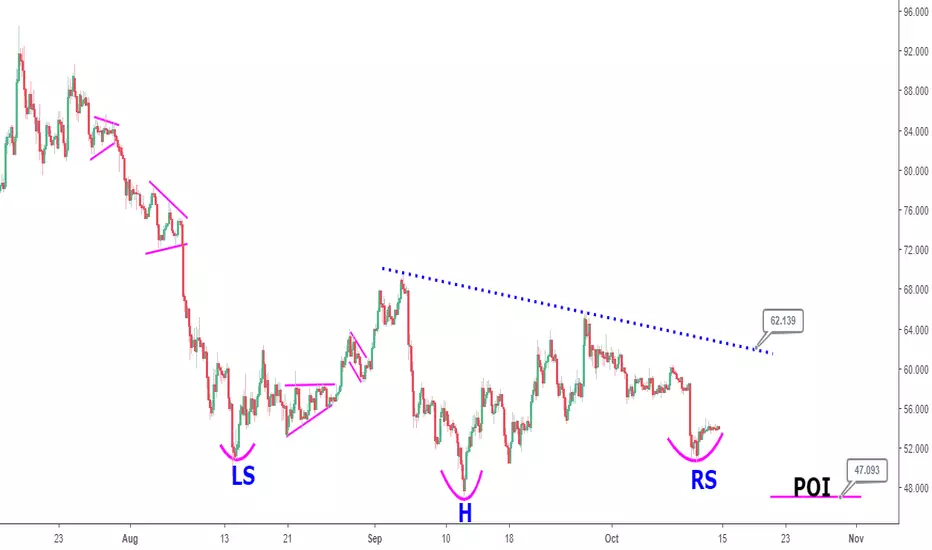
The 4 hour timeframe of Litecoin (LTCUSD) is captured in this analysis from July 24, 2018 to current date. In particular, August 14, 2018 to current date appears to be shaping up as an inverted head and shoulders pattern (or head and shoulders bottom).
The left shoulder (LS), right shoulder (RS) and possible Head (H) of the pattern are marked on the chart. A close above the downward sloping line at ~$62.14, taken as the neckline would confirm the pattern, whose implication is ideally bullish.
Price closing below ~$47.10 (point of invalidation = POI) before closing above $62.14 would invalidate the formation of the bullish pattern in Litecoin.
The left shoulder (LS), right shoulder (RS) and possible Head (H) of the pattern are marked on the chart. A close above the downward sloping line at ~$62.14, taken as the neckline would confirm the pattern, whose implication is ideally bullish.
Price closing below ~$47.10 (point of invalidation = POI) before closing above $62.14 would invalidate the formation of the bullish pattern in Litecoin.

관련 발행물
면책사항
해당 정보와 게시물은 금융, 투자, 트레이딩 또는 기타 유형의 조언이나 권장 사항으로 간주되지 않으며, 트레이딩뷰에서 제공하거나 보증하는 것이 아닙니다. 자세한 내용은 이용 약관을 참조하세요.
면책사항
해당 정보와 게시물은 금융, 투자, 트레이딩 또는 기타 유형의 조언이나 권장 사항으로 간주되지 않으며, 트레이딩뷰에서 제공하거나 보증하는 것이 아닙니다. 자세한 내용은 이용 약관을 참조하세요.