
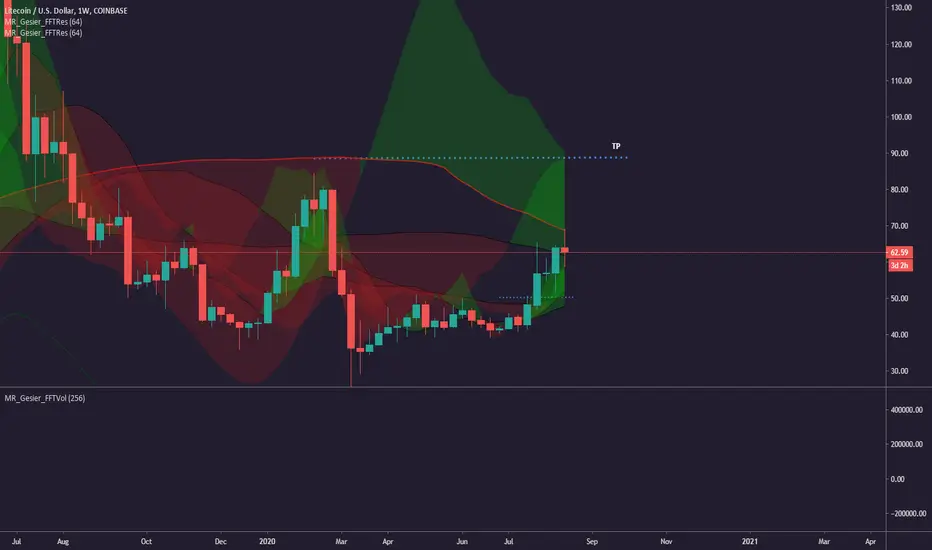
Weekly mapping of the price, we map, forecast not predict in Multi UT analysis ;)
Will depend mostly on weekly closure above the MA (watch out DXY correlation negative).
Some rules to understand the form of the strategy: (Can answer to your question about the content of DFT strategy :) )
- shade of red trends = primary (the black one are secondary trends)
- Redish trends is primary as medium investors are arbitring short/long term investors decisions.
Div: Trend vs demand/supply
-Ascending trends with red cloud is most likely tested twice before break up.
-Descending trends with green cloud is most likely tested twice before break up.
Conv: Trend vs demand/supply
-Ascending trends with green cloud doesn't need retest to break up.
-Descending trends with red cloud doesn't need retest to break down.
red cloud = supply area (Ma max negative dispersion)
green cloud = demand area (MA max postive dispersion)
node = lowest uncertainty point & supply=demand
Will depend mostly on weekly closure above the MA (watch out DXY correlation negative).
Some rules to understand the form of the strategy: (Can answer to your question about the content of DFT strategy :) )
- shade of red trends = primary (the black one are secondary trends)
- Redish trends is primary as medium investors are arbitring short/long term investors decisions.
Div: Trend vs demand/supply
-Ascending trends with red cloud is most likely tested twice before break up.
-Descending trends with green cloud is most likely tested twice before break up.
Conv: Trend vs demand/supply
-Ascending trends with green cloud doesn't need retest to break up.
-Descending trends with red cloud doesn't need retest to break down.
red cloud = supply area (Ma max negative dispersion)
green cloud = demand area (MA max postive dispersion)
node = lowest uncertainty point & supply=demand

면책사항
해당 정보와 게시물은 금융, 투자, 트레이딩 또는 기타 유형의 조언이나 권장 사항으로 간주되지 않으며, 트레이딩뷰에서 제공하거나 보증하는 것이 아닙니다. 자세한 내용은 이용 약관을 참조하세요.
면책사항
해당 정보와 게시물은 금융, 투자, 트레이딩 또는 기타 유형의 조언이나 권장 사항으로 간주되지 않으며, 트레이딩뷰에서 제공하거나 보증하는 것이 아닙니다. 자세한 내용은 이용 약관을 참조하세요.