
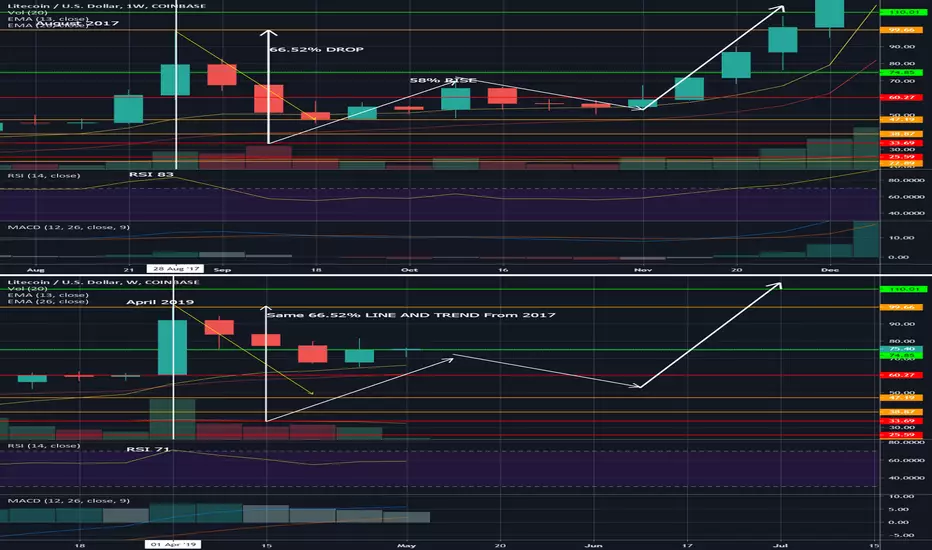
This chart leans me bullish simply because of the correlation. We cannot deny the correlation between August 2017 price action and April 2019. We have our initial spike then three weeks of pull back. Then 1 week green. If this continues, we should have a slightly red week this week followed by a nice green week next week. We have a 57 RSI which is IDENTICAL to 2017 again. This chart has me pretty excited because if history continues to follow then we are in for a massive run starting in 6 WEEKS. That is the one you do not want to miss or be short on. I see us testing back down to the 12EMA at about 66.50 and then bouncing back up close to our current level this week.

면책사항
해당 정보와 게시물은 금융, 투자, 트레이딩 또는 기타 유형의 조언이나 권장 사항으로 간주되지 않으며, 트레이딩뷰에서 제공하거나 보증하는 것이 아닙니다. 자세한 내용은 이용 약관을 참조하세요.
면책사항
해당 정보와 게시물은 금융, 투자, 트레이딩 또는 기타 유형의 조언이나 권장 사항으로 간주되지 않으며, 트레이딩뷰에서 제공하거나 보증하는 것이 아닙니다. 자세한 내용은 이용 약관을 참조하세요.