
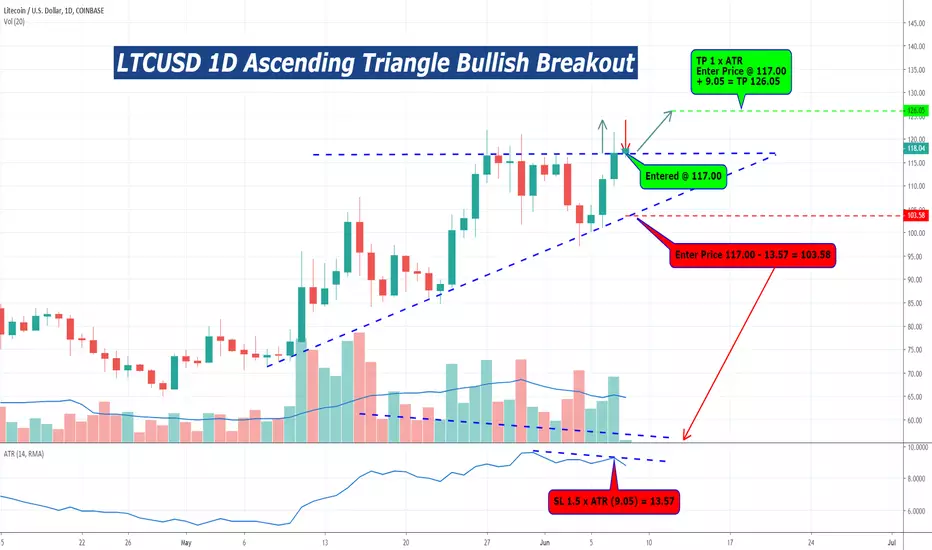
Price is in an ascending triangle chart pattern which is a bullish continuation move
What makes up an ascending triangle?
Great resistance level @ 117.00 tested by 8 candles
There are higher lows
Winding up of price created massive pressure on the resistance level to the upside
Reduction of traders interest in chart pattern
Traders interest is indicated by volume and volatility
Volume represents how much dollars traders have placed on a particular instrument at a certain price range
Volatility is represents ed by ATR by how much price has moved around during a certain time period
Volume spikes are falling off
Volume average line is dropping off
Volatility is dropping off y falling ATR line which represents smaller candle bar sizes
Ascending Triangle is a continual bullish chart pattern - trade only long
Trading Plan
Watch for a daily candle close above resistance level of 117.00
Make sure breakout candle has an average or + volume bar
If volume bar is to or above the average line then trade 100% your risk reward ratio (2% of Trade Account)
If volume bar is 75% to average line then trade 50%% of your risk reward ratio (1% of Trade Account)
Take two trades
Both trades SL is 1.5 x ATR of breakout candle
1st trade TP is 1 x ATR of breakout candle
When 1st trade TP is hit, move 2nd trade SL to break even and let profit run
Follow 2nd trade profit with SL
What makes up an ascending triangle?
Great resistance level @ 117.00 tested by 8 candles
There are higher lows
Winding up of price created massive pressure on the resistance level to the upside
Reduction of traders interest in chart pattern
Traders interest is indicated by volume and volatility
Volume represents how much dollars traders have placed on a particular instrument at a certain price range
Volatility is represents ed by ATR by how much price has moved around during a certain time period
Volume spikes are falling off
Volume average line is dropping off
Volatility is dropping off y falling ATR line which represents smaller candle bar sizes
Ascending Triangle is a continual bullish chart pattern - trade only long
Trading Plan
Watch for a daily candle close above resistance level of 117.00
Make sure breakout candle has an average or + volume bar
If volume bar is to or above the average line then trade 100% your risk reward ratio (2% of Trade Account)
If volume bar is 75% to average line then trade 50%% of your risk reward ratio (1% of Trade Account)
Take two trades
Both trades SL is 1.5 x ATR of breakout candle
1st trade TP is 1 x ATR of breakout candle
When 1st trade TP is hit, move 2nd trade SL to break even and let profit run
Follow 2nd trade profit with SL
노트

면책사항
해당 정보와 게시물은 금융, 투자, 트레이딩 또는 기타 유형의 조언이나 권장 사항으로 간주되지 않으며, 트레이딩뷰에서 제공하거나 보증하는 것이 아닙니다. 자세한 내용은 이용 약관을 참조하세요.
면책사항
해당 정보와 게시물은 금융, 투자, 트레이딩 또는 기타 유형의 조언이나 권장 사항으로 간주되지 않으며, 트레이딩뷰에서 제공하거나 보증하는 것이 아닙니다. 자세한 내용은 이용 약관을 참조하세요.